AI Integration
此内容尚不支持你的语言。
Pro Feature
AI integration features require a Pro license. This includes live context files and ready-made prompts.
Overview
Section titled “Overview”GalataJ integrates with AI assistants (ChatGPT, Claude, Cursor, GitHub Copilot, etc.) to help you analyze performance data and get optimization suggestions. The plugin automatically generates context files that AI can read.
Live Performance Context
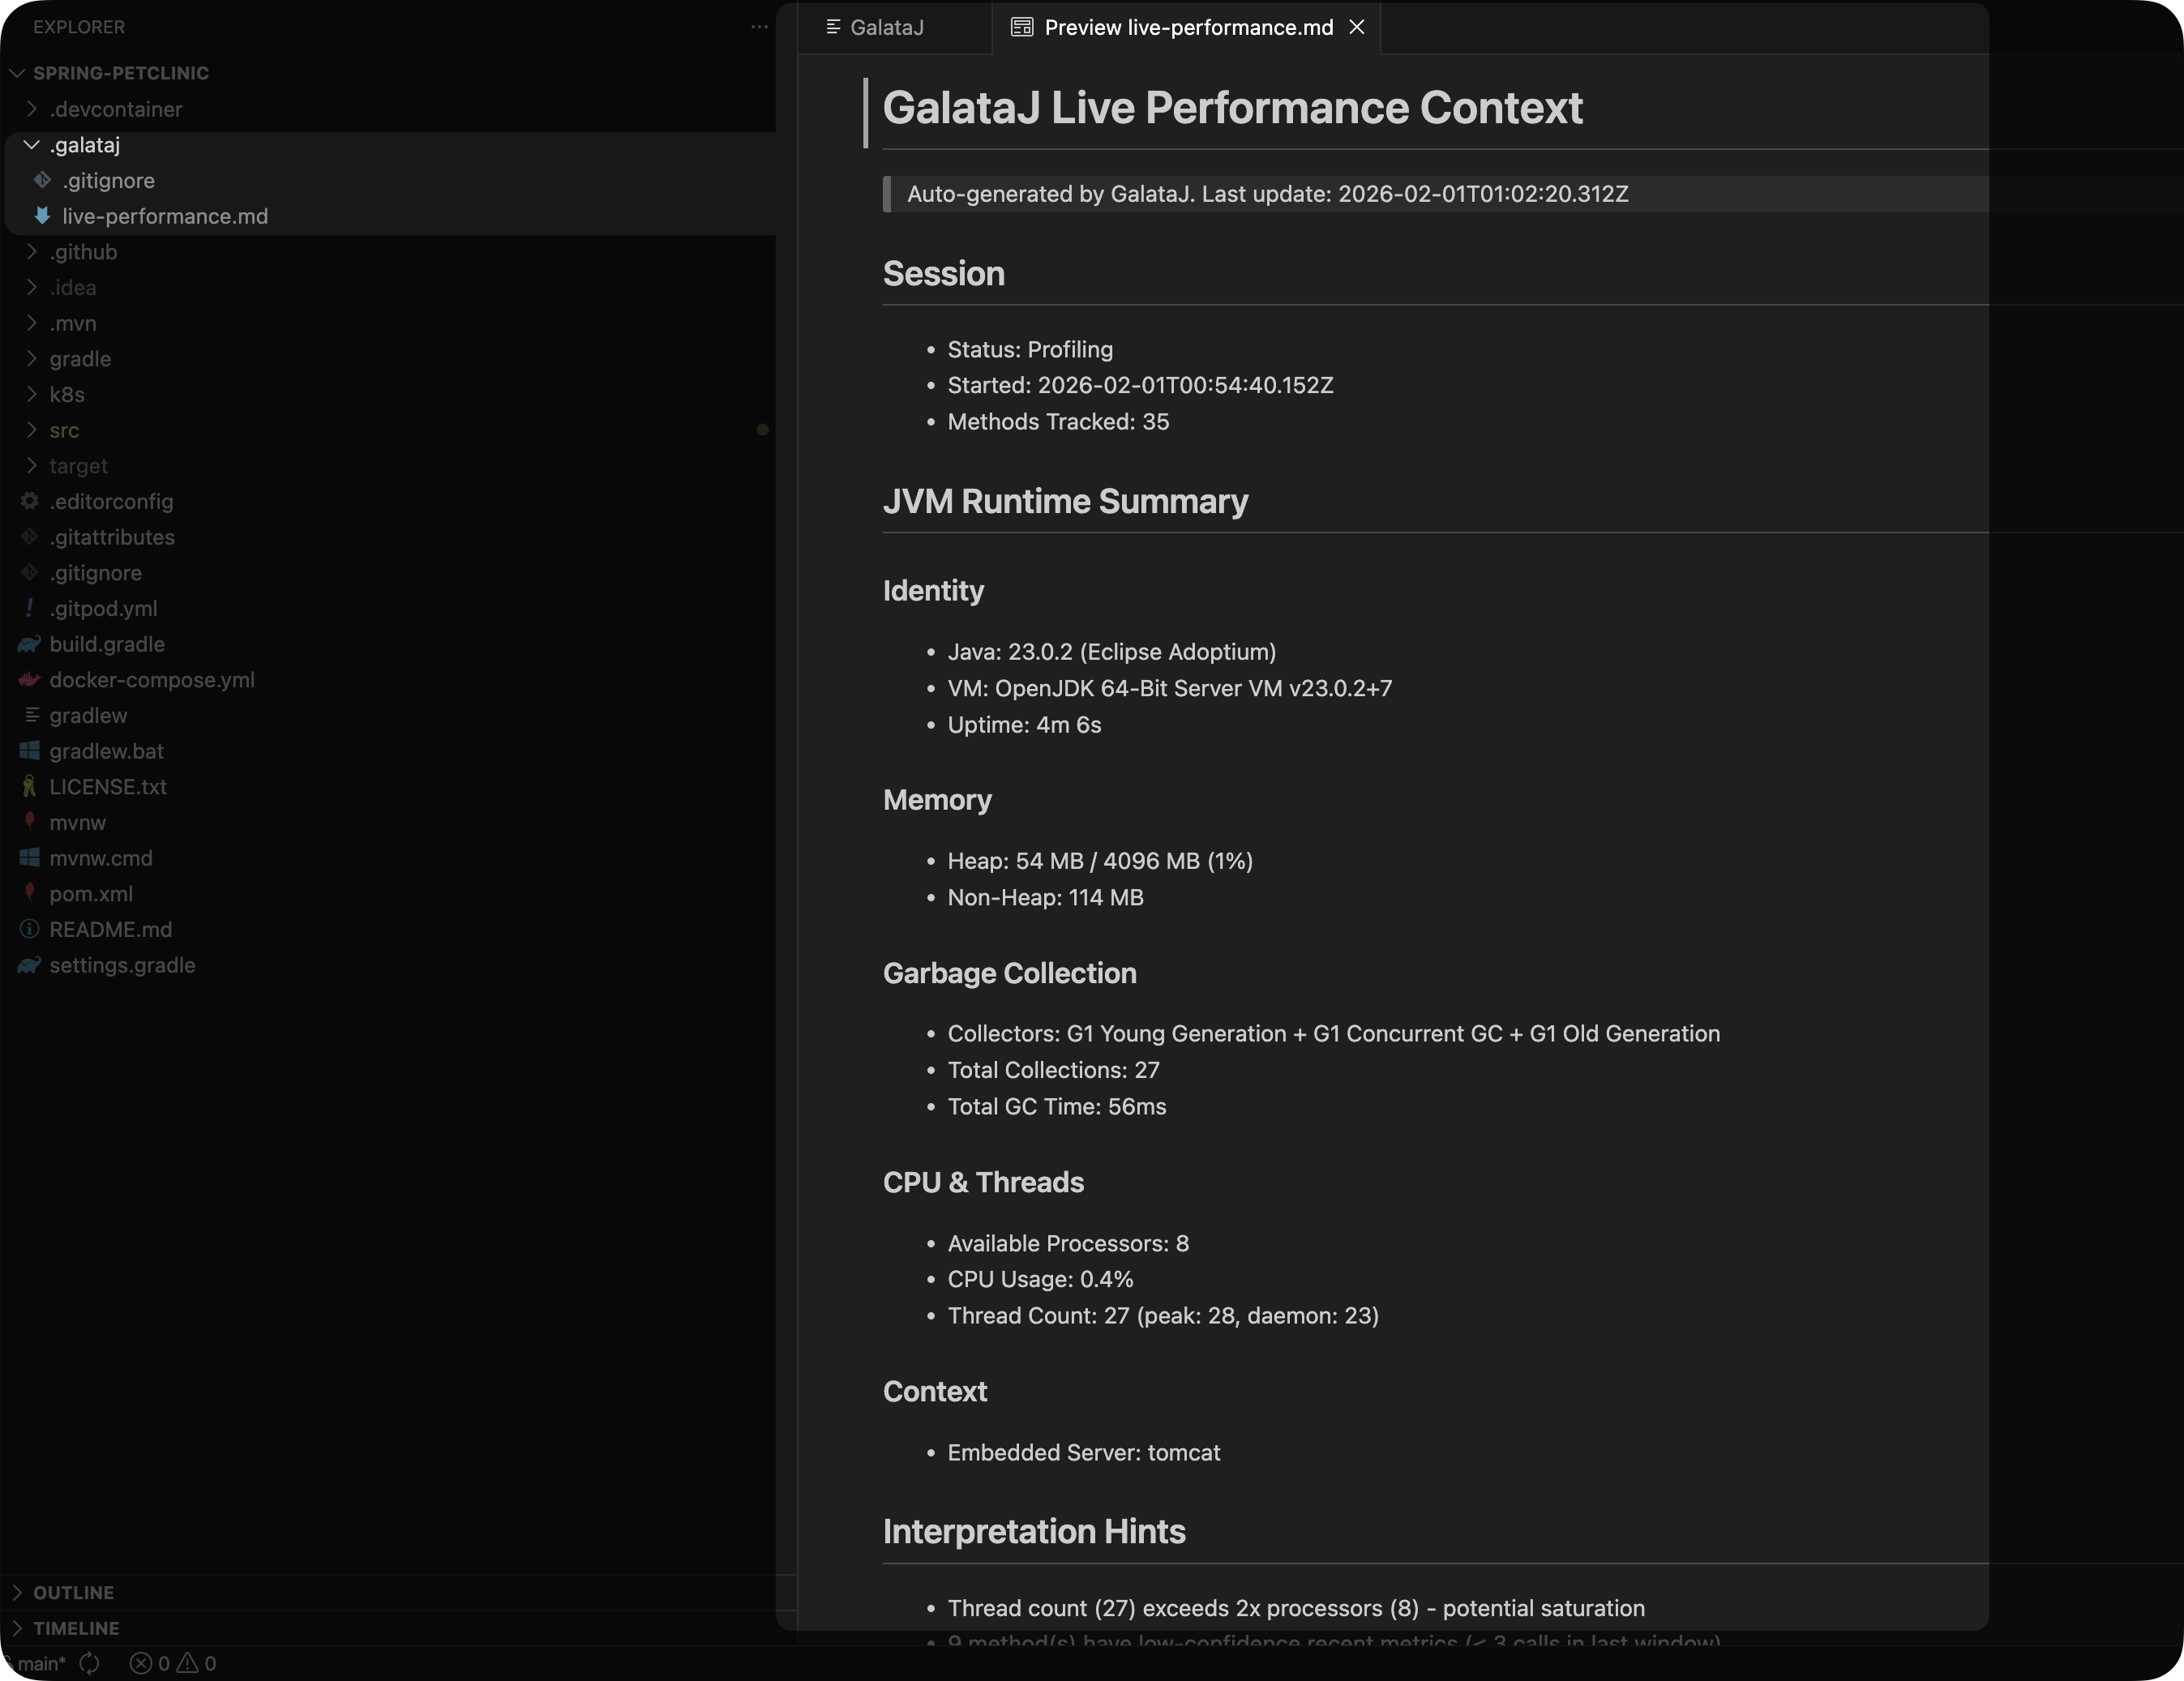
Section titled “Live Performance Context”GalataJ automatically generates a live-performance.md file in your project’s .galataj/ folder. This file contains real-time profiling data formatted for AI consumption.
File Location
Section titled “File Location”your-project/├── .galataj/│ ├── live-performance.md ← Current profiling data│ └── baseline-live-compare.md ← Comparison with baseline├── src/└── ...What’s in live-performance.md
Section titled “What’s in live-performance.md”The file includes:
# GalataJ Live Performance ReportGenerated: 2024-01-15 14:30:22
## JVM Runtime Summary- Java: 21.0.1 (Eclipse Adoptium)- Heap: 245 MB / 512 MB (48%)- GC: G1GC (12 collections, 180ms total)- Processors: 8, Threads: 42
## Top Methods by CPU Time
| Method | Avg CPU | Max CPU | Calls | Alloc ||--------|---------|---------|-------|-------|| OrderService.processOrder | 45.2ms | 120.5ms | 1,234 | 82KB || PaymentGateway.charge | 38.1ms | 95.2ms | 456 | 24KB || UserRepository.findById | 12.3ms | 45.6ms | 3,421 | 8KB |
## Context Detection- HTTP Endpoints: 12 tracked- Database Queries: 8 patterns detected- Scheduled Tasks: 3 activeAuto-Refresh
Section titled “Auto-Refresh”The file updates automatically while profiling is active:
- Default interval: Every 5 seconds
- Configurable: Settings → GalataJ → Live Context Refresh
Baseline Live Compare
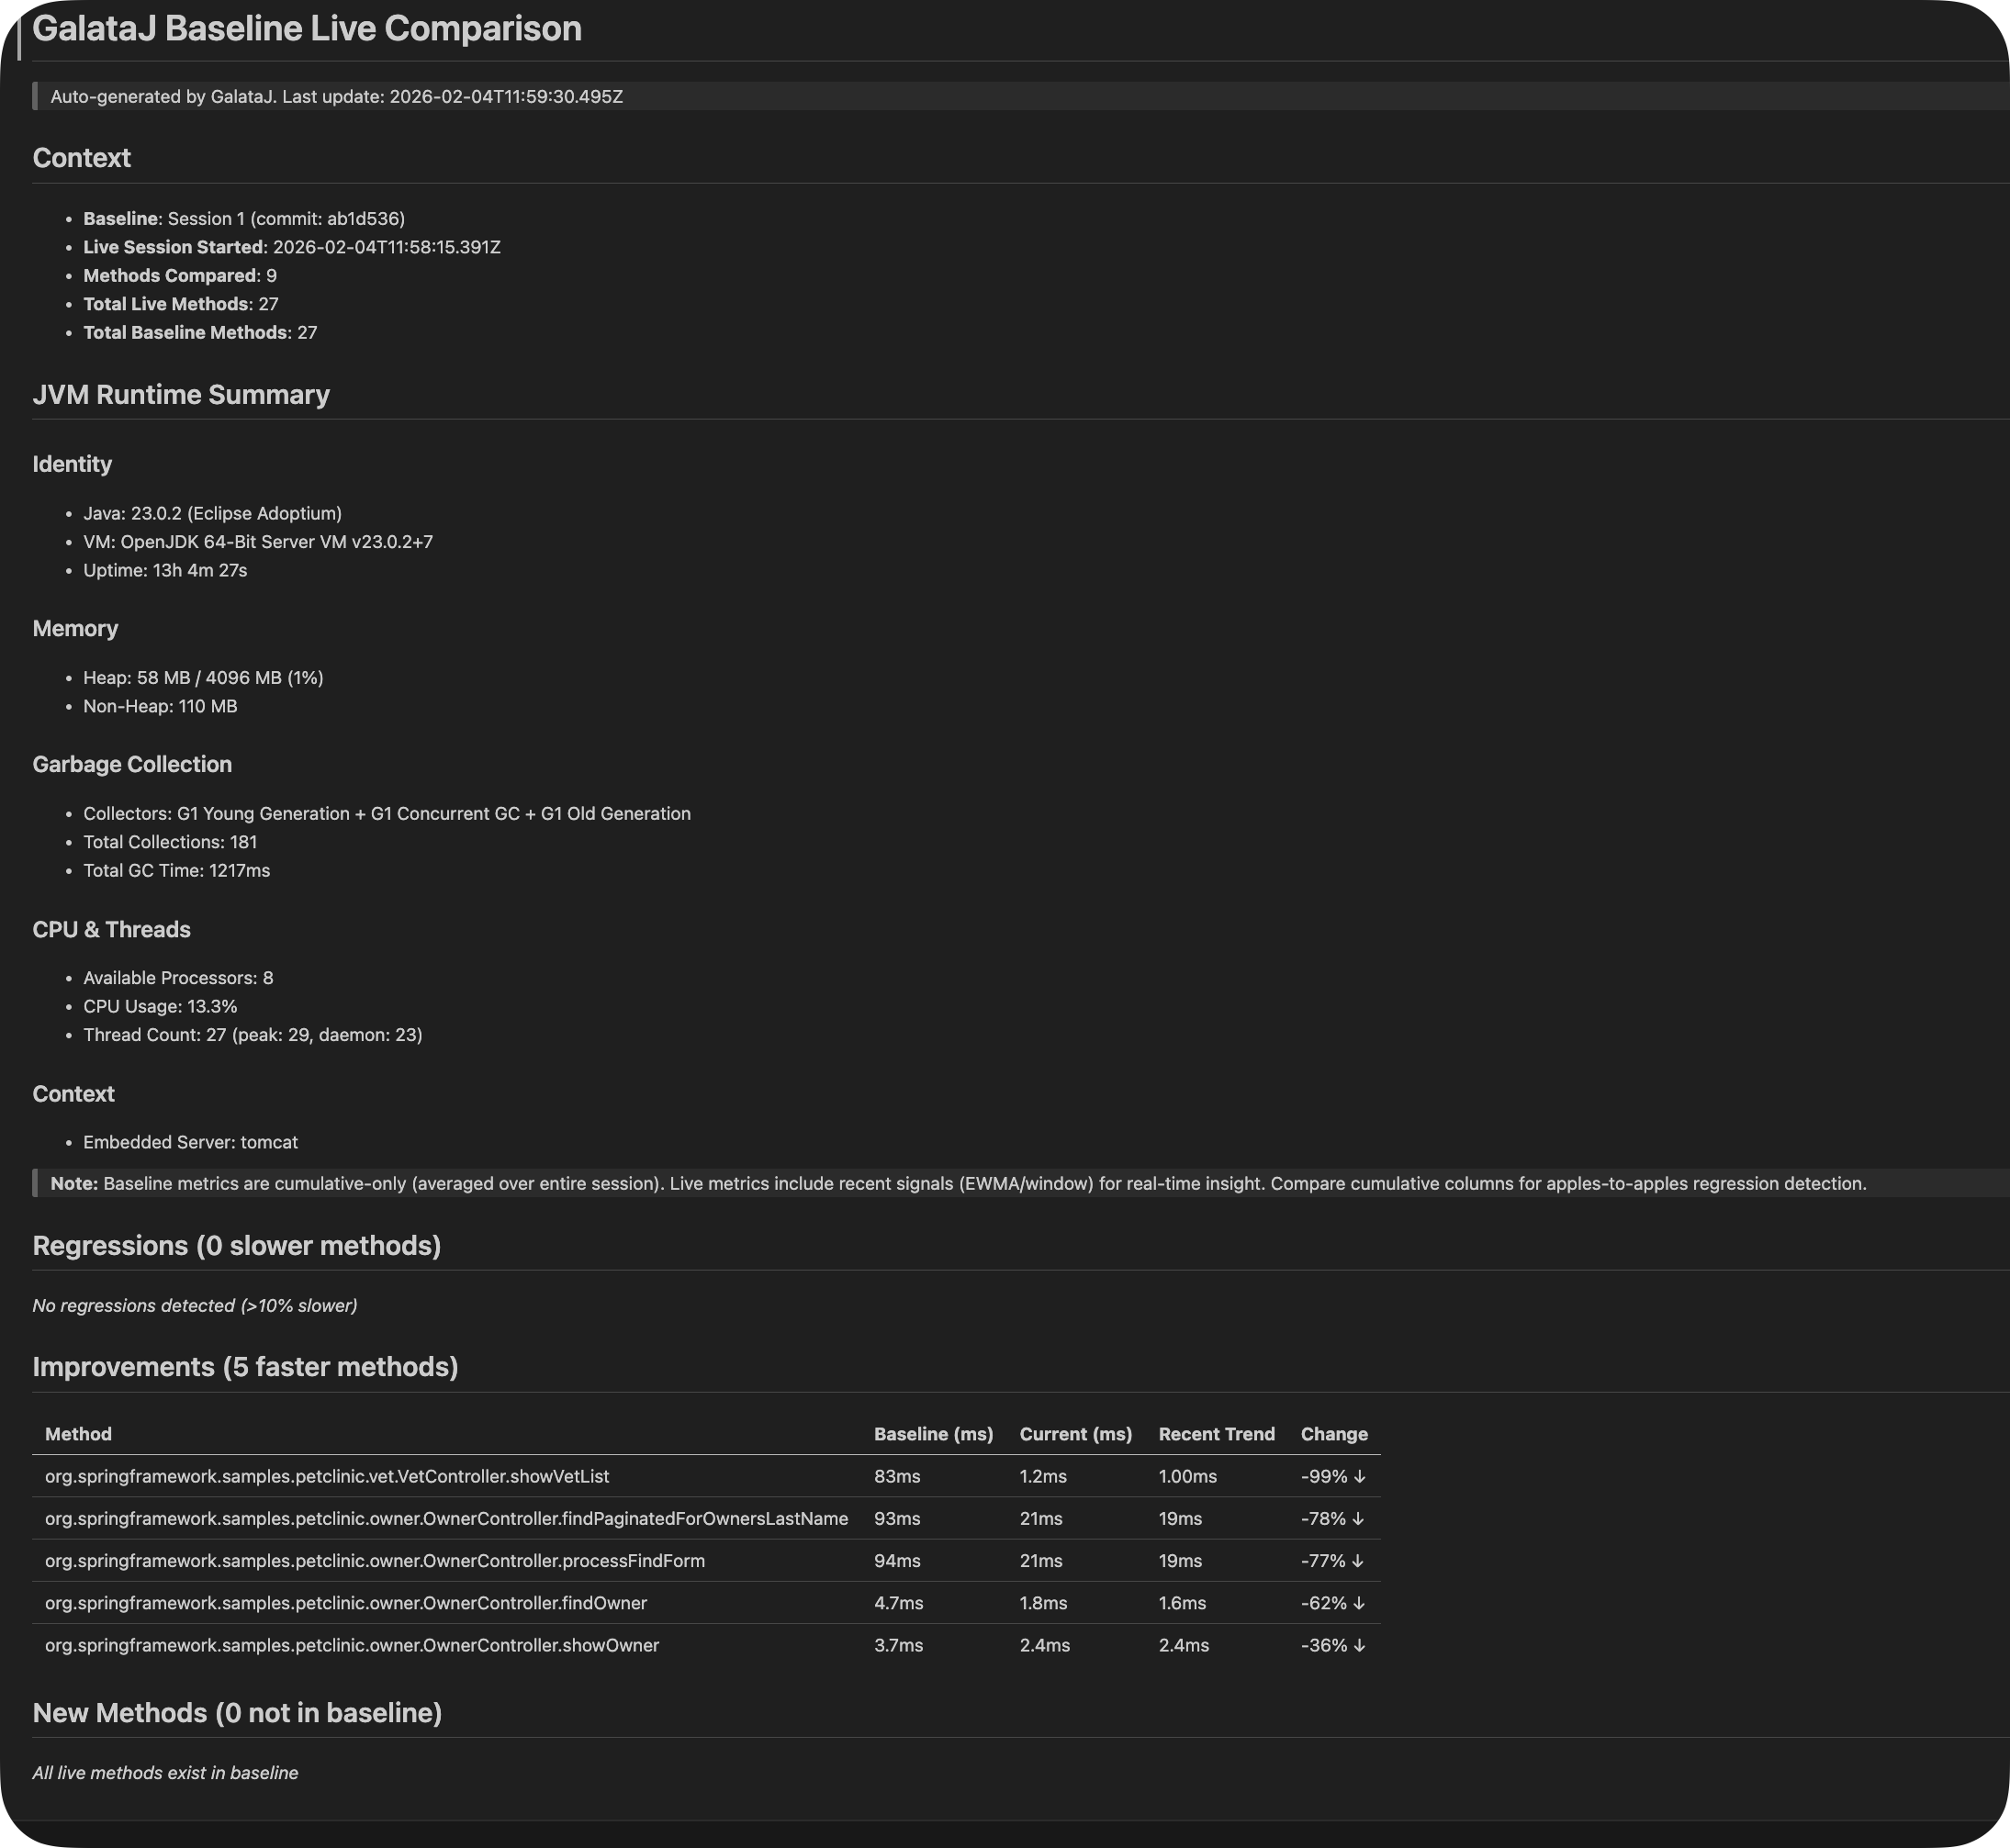
Section titled “Baseline Live Compare”When you have a baseline set, GalataJ also generates baseline-live-compare.md showing real-time comparison between your baseline and current performance.
What’s in baseline-live-compare.md
Section titled “What’s in baseline-live-compare.md”# Baseline vs Live ComparisonBaseline: "v2.0.0 Release" (2024-01-10)Live: Current session
## Summary- Methods improved: 12- Methods regressed: 3- Methods unchanged: 45
## Regressions (Attention Required)
| Method | Baseline | Live | Delta | Trend ||--------|----------|------|-------|-------|| OrderService.validate | 5.2ms | 12.8ms | +146% | ↑ SLOWER || CacheService.get | 0.3ms | 2.1ms | +600% | ↑ SLOWER |
## Improvements
| Method | Baseline | Live | Delta | Trend ||--------|----------|------|-------|-------|| ReportGenerator.build | 850ms | 120ms | -86% | ↓ FASTER |AI Tip
When asking AI about performance, point it to these files: “Read .galataj/live-performance.md and suggest optimizations for the slowest methods”
Ready-Made AI Prompts
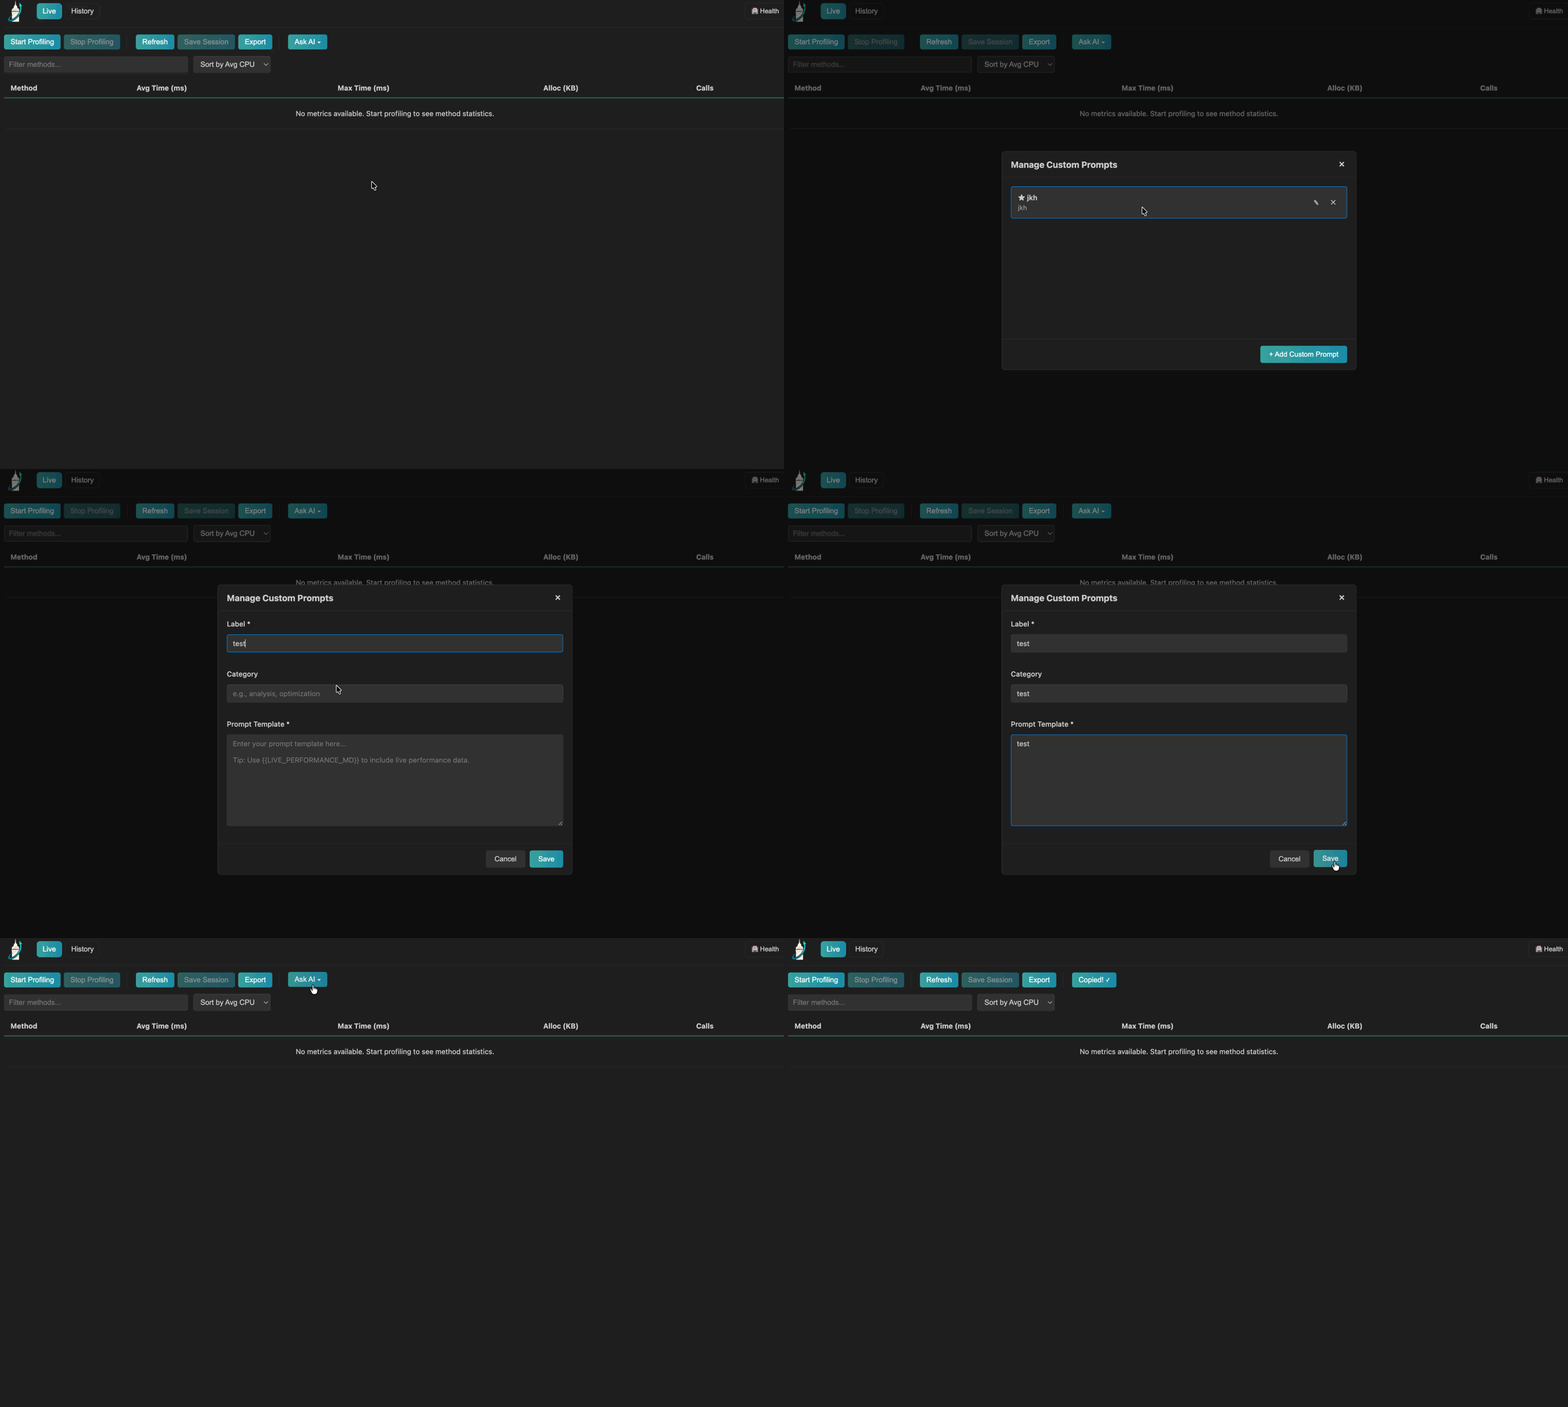
Section titled “Ready-Made AI Prompts”GalataJ includes pre-built prompts optimized for performance analysis. Copy them with one click and paste into your AI assistant.
Accessing Prompts
Section titled “Accessing Prompts”IntelliJ IDEA:
- Open the Profiler tool window
- Click the AI Prompts dropdown
- Select a prompt
- Click Copy to Clipboard
VS Code / Cursor / Windsurf:
- Open the GalataJ sidebar panel
- Find the AI Prompts section
- Click on a prompt to copy
Available Prompts
Section titled “Available Prompts”Analyze Performance Regressions
Identifies hotspots, analyzes bottlenecks (CPU vs IO), detects unusual patterns, compares against baseline.
Suggest Concrete Optimizations
Provides code-level fixes: algorithm improvements, caching opportunities, N+1 query fixes, memory reduction.
GC & Memory Analysis
Analyzes allocation patterns, object churn, potential leaks, and suggests object pooling, StringBuilder usage.
IO vs CPU Bound Diagnosis
Determines if methods are CPU-bound, IO-bound, or suffering from lock contention. Recommends appropriate solutions.
Prompt Examples
Section titled “Prompt Examples”Analyze Performance Regressions
Section titled “Analyze Performance Regressions”Context: Java/Spring Boot application runtime profiling data.
Goal:1. Identify the top performance hotspots2. Analyze potential bottlenecks (CPU-bound vs IO-bound)3. Look for unusual patterns (high call counts, memory allocation spikes)4. Compare against baseline if available
Provide a concise analysis focusing on actionable insights.Suggest Concrete Optimizations
Section titled “Suggest Concrete Optimizations”Context: Java/Spring Boot application runtime profiling data.
Goal:Suggest specific, code-level optimizations for the slowest methods. Focus on:1. Algorithm improvements (O(n) complexity reductions)2. Caching opportunities3. Database query optimizations (N+1, missing indexes)4. Memory allocation reduction
For each suggestion:- Explain WHY it would help- Provide a code example if applicable- Estimate potential improvementGC & Memory Analysis
Section titled “GC & Memory Analysis”Context: Java/Spring Boot application runtime profiling data.
Goal:Analyze memory allocation patterns and potential GC pressure:1. Methods with high allocation rates2. Object churn patterns (many small allocations)3. Potential memory leaks (growing allocations over time)4. Large object allocations that might bypass TLAB
Suggest:- Object pooling opportunities- StringBuilder vs String concatenation- Collection sizing optimizations- Stream vs loop trade-offsCopy AI Rules Button
Section titled “Copy AI Rules Button”For AI assistants like Cursor that support custom rules, GalataJ provides a special “Copy AI Rules” button. This copies a ruleset that teaches the AI how to work with GalataJ data.
AI Rules Content
Section titled “AI Rules Content”# GalataJ Performance Analysis Rules
When analyzing Java/Spring Boot performance, always consider:
## Data Sources- Read .galataj/live-performance.md for current profiling data- Read .galataj/baseline-live-compare.md for baseline comparisons
## Analysis Guidelines1. Focus on methods with highest avgCpuMs first2. Check callCount - high counts may indicate N+1 queries3. Compare against baseline for regression detection4. Consider thread context (request vs async vs scheduler)
## Response Format- Be concise and actionable- Provide code examples when suggesting fixes- Prioritize by impact (CPU time × call count)- Always explain WHY a change would helpUsing with Cursor
Section titled “Using with Cursor”- Click Copy AI Rules
- Open Cursor Settings → Rules
- Paste the rules
- Cursor will now automatically consider GalataJ data
Using with Different AI Tools
Section titled “Using with Different AI Tools”ChatGPT / Claude
Section titled “ChatGPT / Claude”- Copy the desired prompt from GalataJ
- Open the AI chat
- Paste the prompt
- Copy contents of
.galataj/live-performance.md - Paste and send
Cursor / Windsurf
Section titled “Cursor / Windsurf”- Add AI Rules to your IDE settings
- Ask questions like:
- “Why is OrderService.processOrder slow?”
- “How can I optimize the top 5 methods in live-performance.md?”
- “Compare baseline vs live and explain the regressions”
GitHub Copilot Chat
Section titled “GitHub Copilot Chat”- Open Copilot Chat
- Type: “Read @.galataj/live-performance.md and suggest optimizations”
Understanding AI Context Tiers
Section titled “Understanding AI Context Tiers”GalataJ collects different levels of data for AI analysis:
Tier 1: Always-On
Zero overhead
Method metrics, call counts, execution time, allocations
Tier 2: Environment
Low overhead
JVM info, heap usage, GC stats, thread counts
Tier 3: Deep
Opt-in (Future)
Thread dumps, JFR excerpts, stack traces
What We DON’T Collect
Section titled “What We DON’T Collect”- ❌ Request/response bodies
- ❌ User data or PII
- ❌ Database query contents
- ❌ Environment variables
- ❌ Sensitive JVM flags
Best Practices
Section titled “Best Practices”Be Specific in Your Questions
Instead of “Why is my app slow?”, ask “Why is UserService.findAll taking 200ms when baseline was 20ms?”
Include Context
Always point the AI to your .galataj/ files. The more context, the better the suggestions.
Verify Suggestions
AI suggestions are starting points. Always profile again after implementing changes to verify improvements.
Troubleshooting
Section titled “Troubleshooting”| Issue | Solution |
|---|---|
| Files not generated | Check Pro license: galataj license status |
| Files not updating | Ensure profiling is active and refresh interval is set |
| AI gives generic advice | Make sure you included the file contents, not just the path |
| Prompts not showing | Refresh prompts in settings or restart the plugin |
Next Steps
Section titled “Next Steps”- History Panel - Save and compare sessions
- Configuration - Customize AI context settings
- CLI Reference - Command-line AI export options