IntelliJ IDEA
Veja métricas de desempenho diretamente no seu editor de código IntelliJ IDEA.
Requisitos
IntelliJ IDEA 2024.1 ou posterior
Instalação
Seção intitulada “Instalação”- Vá para Configurações → Plugins → Marketplace
- Pesquise por “GalataJ”
- Clique em Instalar
- Reinicie o IntelliJ quando solicitado
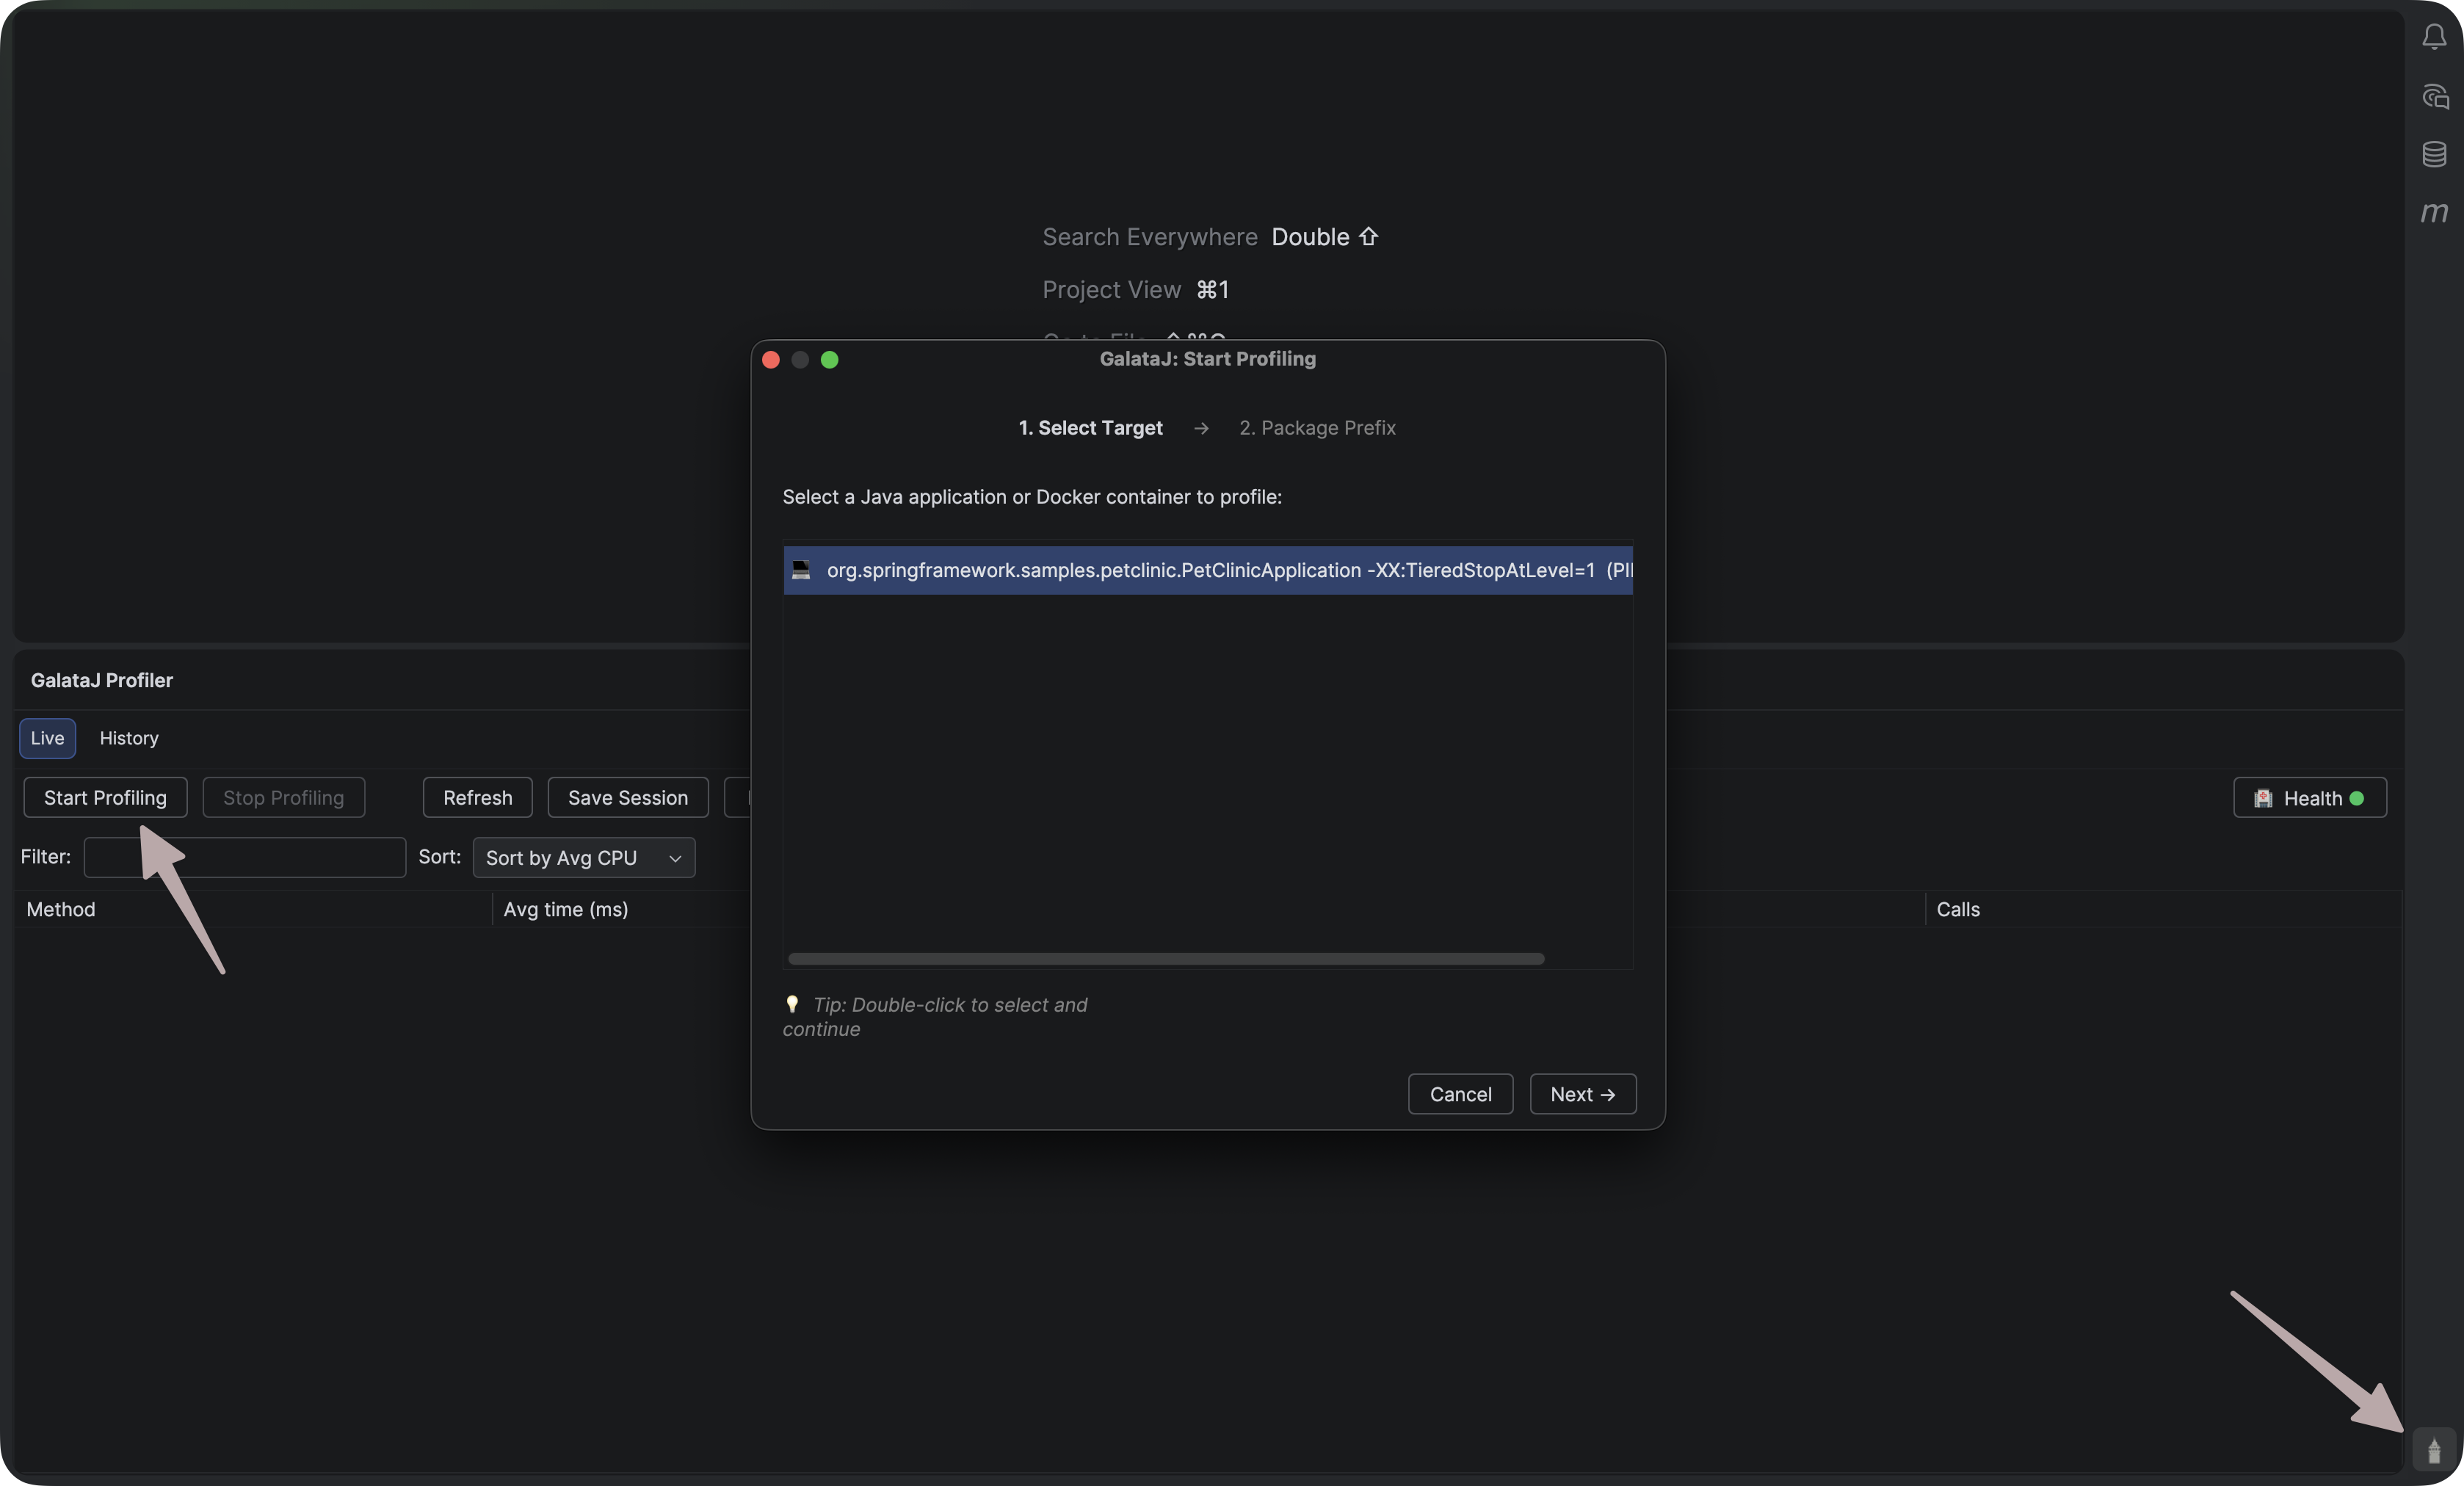
Iniciar Perfilamento
Seção intitulada “Iniciar Perfilamento”- Execute sua aplicação Java
- Vá para Run → Start GalataJ Profiling
- Selecione sua JVM da lista
- Clique em Start
É isso! Métricas aparecerão acima dos seus métodos.
Dicas Inline
Seção intitulada “Dicas Inline”Dados de desempenho aparecem diretamente acima dos seus métodos:
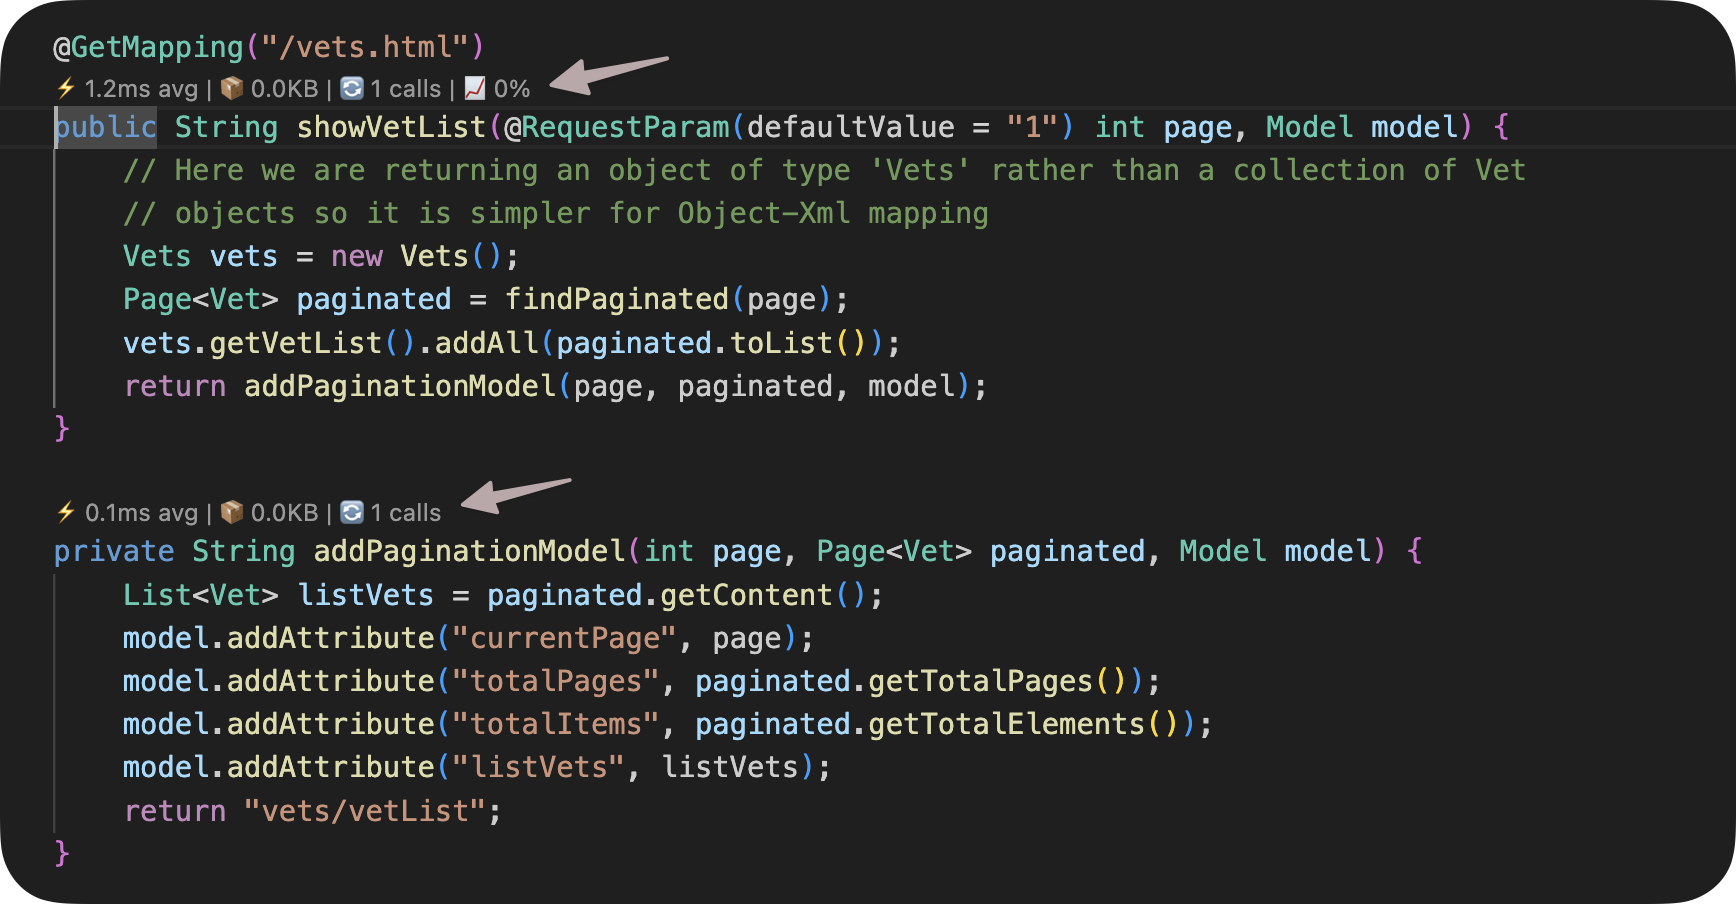
Métricas mostradas:
- Avg — Tempo médio de execução
- Max — Tempo máximo de execução
- Calls — Número de invocações
- Trend — Mudança de desempenho (↑ mais lento, ↓ mais rápido)
Passe o mouse sobre uma dica para mais detalhes.
Parar Perfilamento
Seção intitulada “Parar Perfilamento”Vá para Run → Stop GalataJ Profiling
Solução de Problemas
Seção intitulada “Solução de Problemas”JVM não aparece
Seção intitulada “JVM não aparece”Clique em Atualizar no painel do profiler. Certifique-se de que sua aplicação Java está em execução.
Sem métricas
Seção intitulada “Sem métricas”- Verifique se o perfilamento está ativo (barra de status mostra “Profiling”)
- Abra arquivos do pacote perfilado
- Aguarde alguns segundos para os dados chegarem
Dicas não visíveis
Seção intitulada “Dicas não visíveis”Vá para Configurações → Editor → Inlay Hints → Code Vision → GalataJ e certifique-se de que está habilitado.
Precisa de mais ajuda?
Seção intitulada “Precisa de mais ajuda?”Clique em Health no painel do profiler para uma verificação de diagnóstico.