IntelliJ IDEA
See performance metrics directly in your IntelliJ IDEA code editor.
Requirements
IntelliJ IDEA 2024.1 or later
Installation
Section titled “Installation”- Go to Settings → Plugins → Marketplace
- Search for “GalataJ”
- Click Install
- Restart IntelliJ when prompted
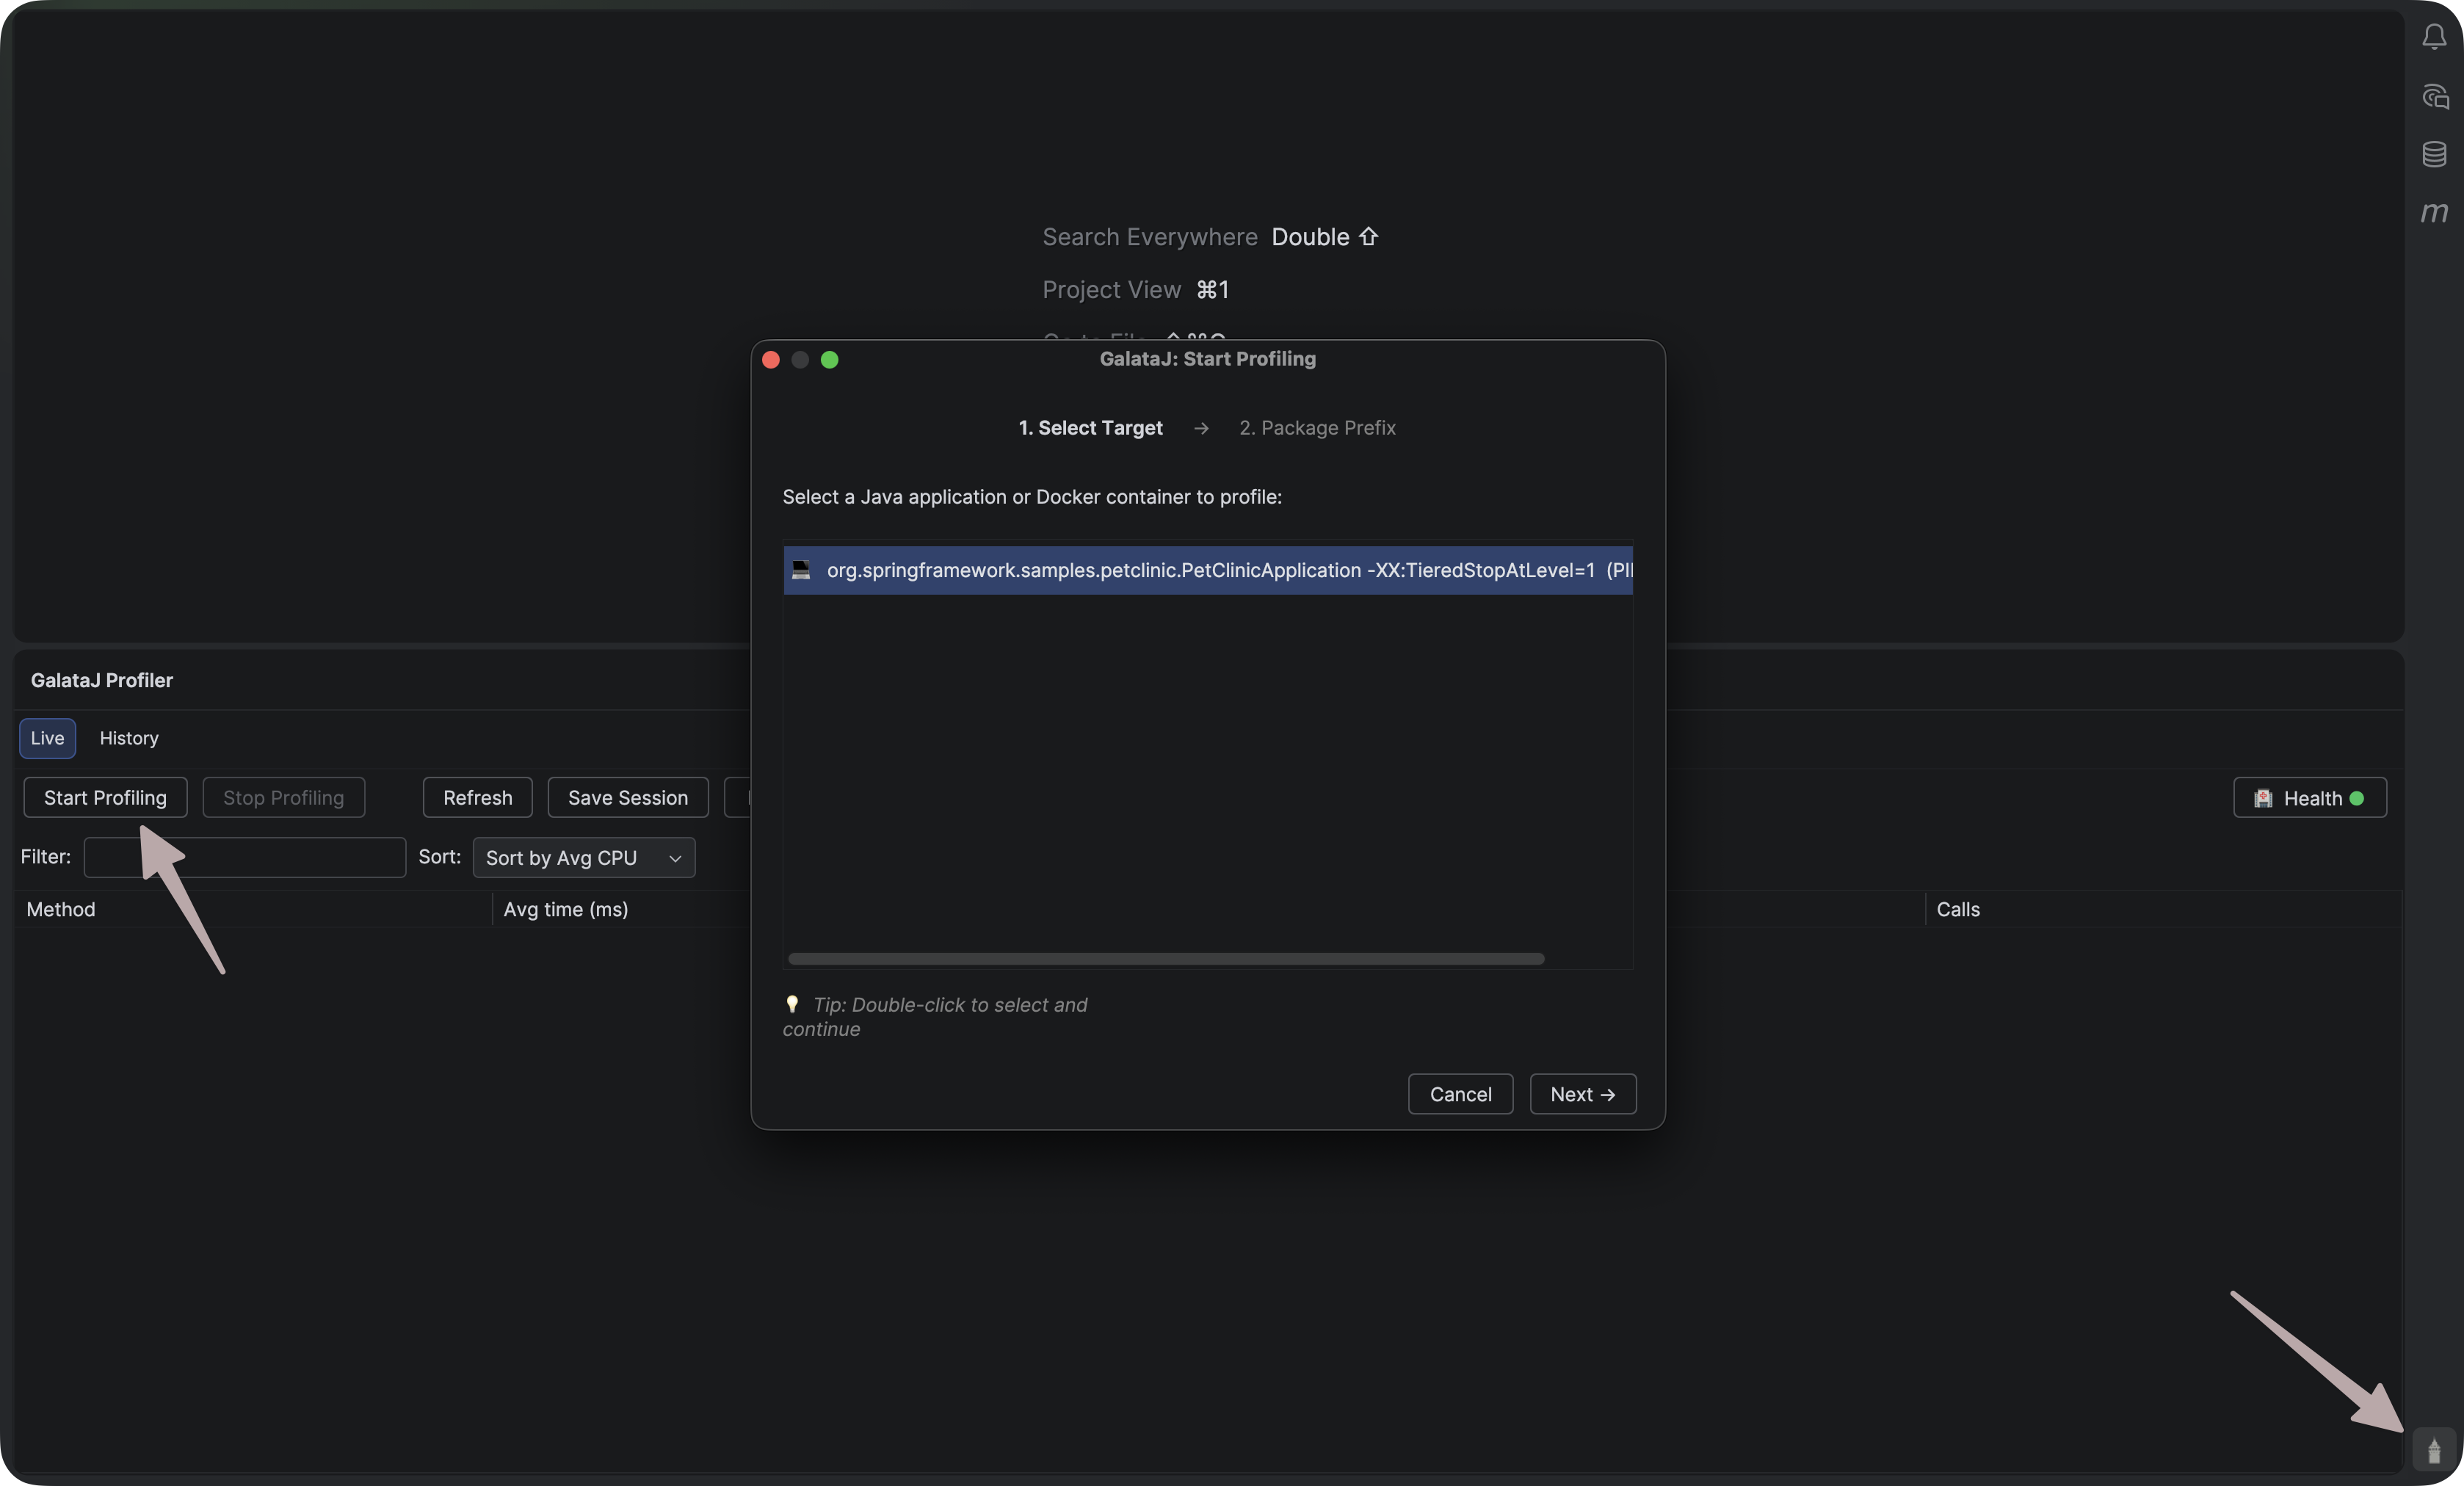
Start Profiling
Section titled “Start Profiling”- Run your Java application
- Go to Run → Start GalataJ Profiling
- Select your JVM from the list
- Click Start
That’s it! Metrics will appear above your methods.
Inline Hints
Section titled “Inline Hints”Performance data appears directly above your methods:
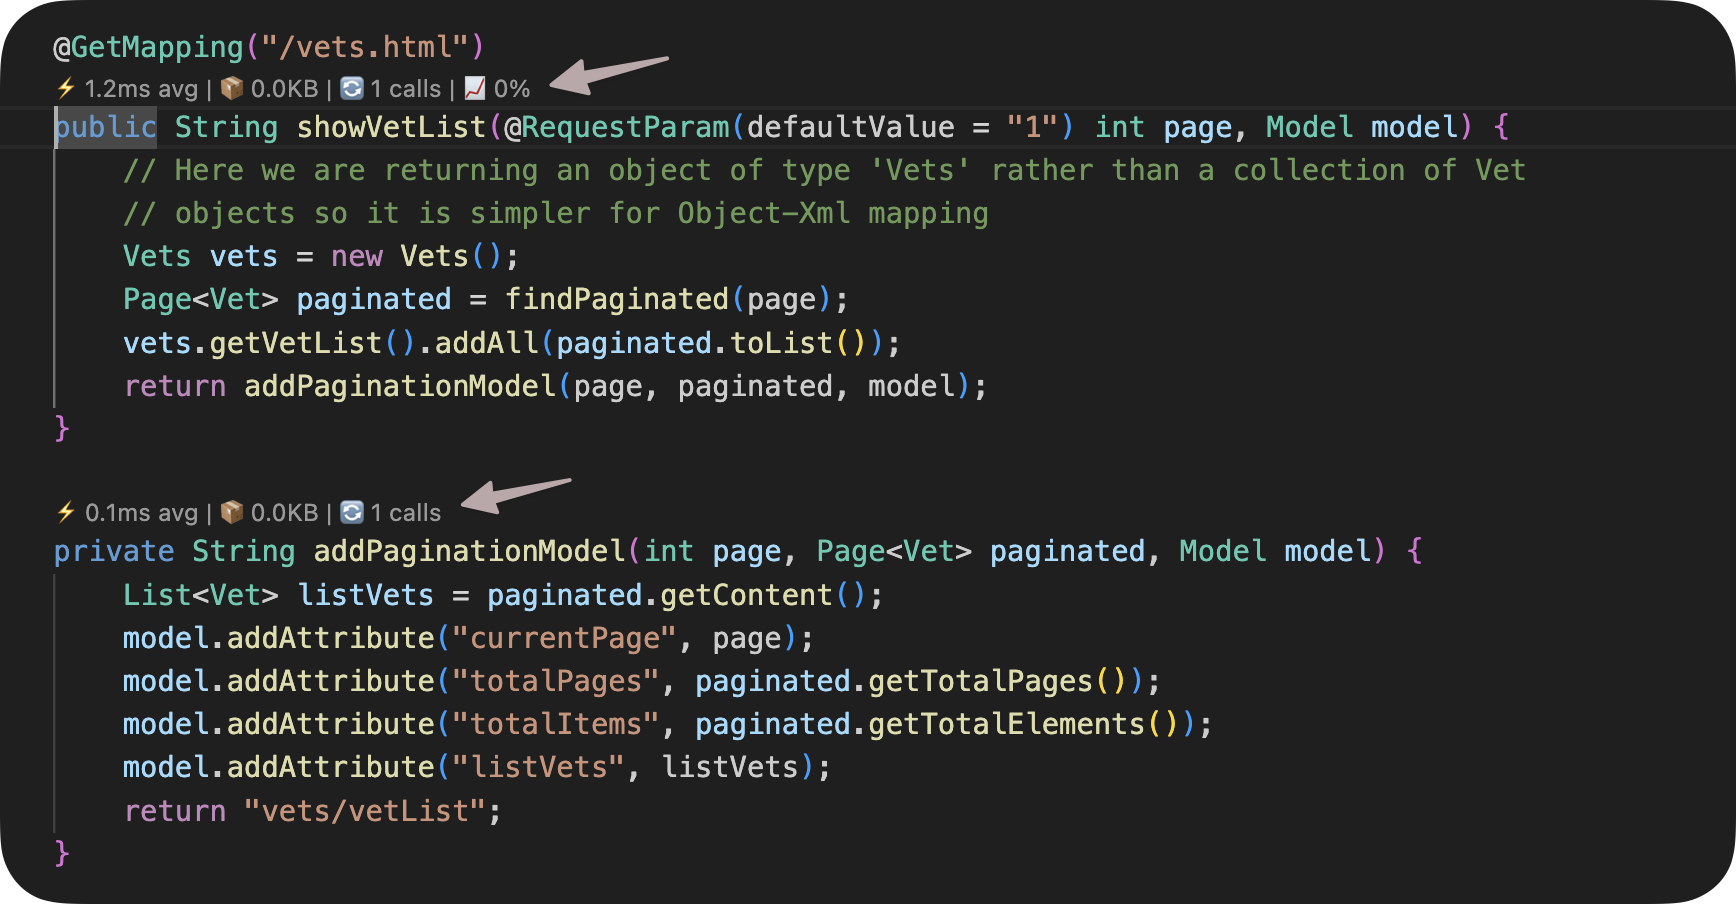
Metrics shown:
- Avg — Average execution time
- Max — Maximum execution time
- Calls — Number of invocations
- Trend — Performance change (↑ slower, ↓ faster)
Hover over a hint for more details.
Stop Profiling
Section titled “Stop Profiling”Go to Run → Stop GalataJ Profiling
Troubleshooting
Section titled “Troubleshooting”JVM not appearing
Section titled “JVM not appearing”Click Refresh in the profiler panel. Make sure your Java app is running.
No metrics showing
Section titled “No metrics showing”- Check that profiling is active (status bar shows “Profiling”)
- Open files from the profiled package
- Wait a few seconds for data to arrive
Hints not visible
Section titled “Hints not visible”Go to Settings → Editor → Inlay Hints → Code Vision → GalataJ and make sure it’s enabled.
Need more help?
Section titled “Need more help?”Click Health in the profiler panel for a diagnostic check.