Profile. Compare. Act.
Java method profiling — inline in your IDE
See per-method execution time and call count in your editor. Compare sessions to track regressions. Export structured performance data for analysis.
Works in IntelliJ IDEA Community & Ultimate, and VS Code
Profile → Compare → Act — all inside your IDE
How GalataJ Works
Three steps. One IDE. No context switching.
Profile
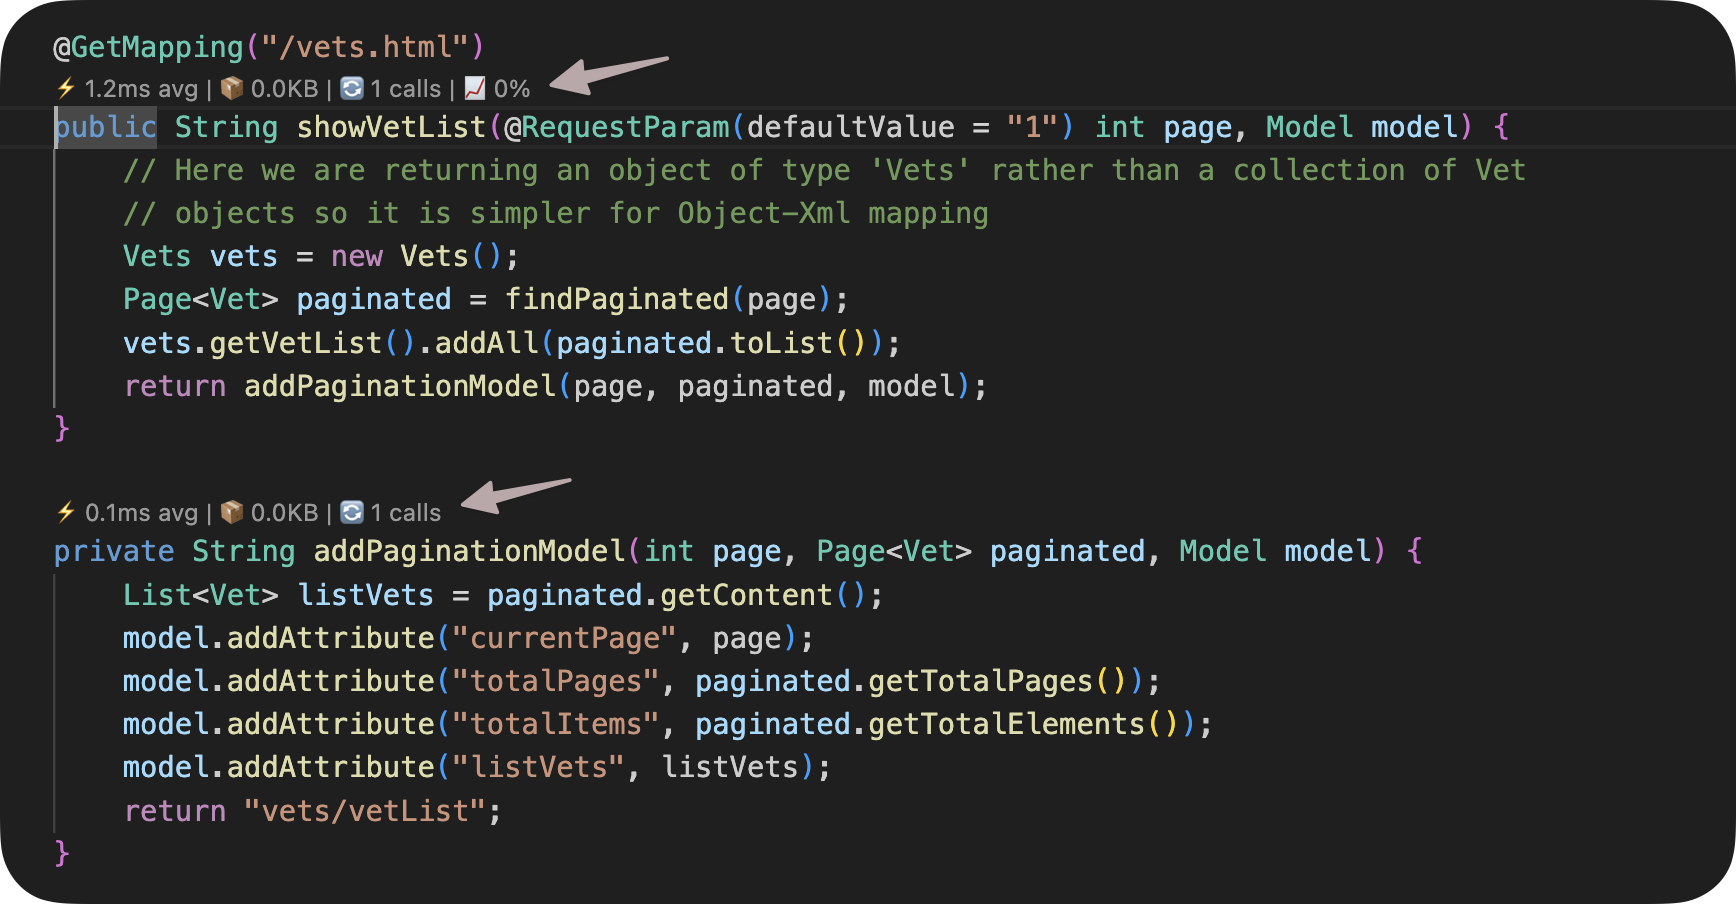
Inline Method Metrics
Execution time, call count, and memory allocation appear as CodeLens hints directly above your methods. No dashboards, no separate tools.
- Real-time metrics updated as your app runs
- Live profiling tab with sortable data
- Context detection for HTTP, DB, and Scheduler calls
Compare
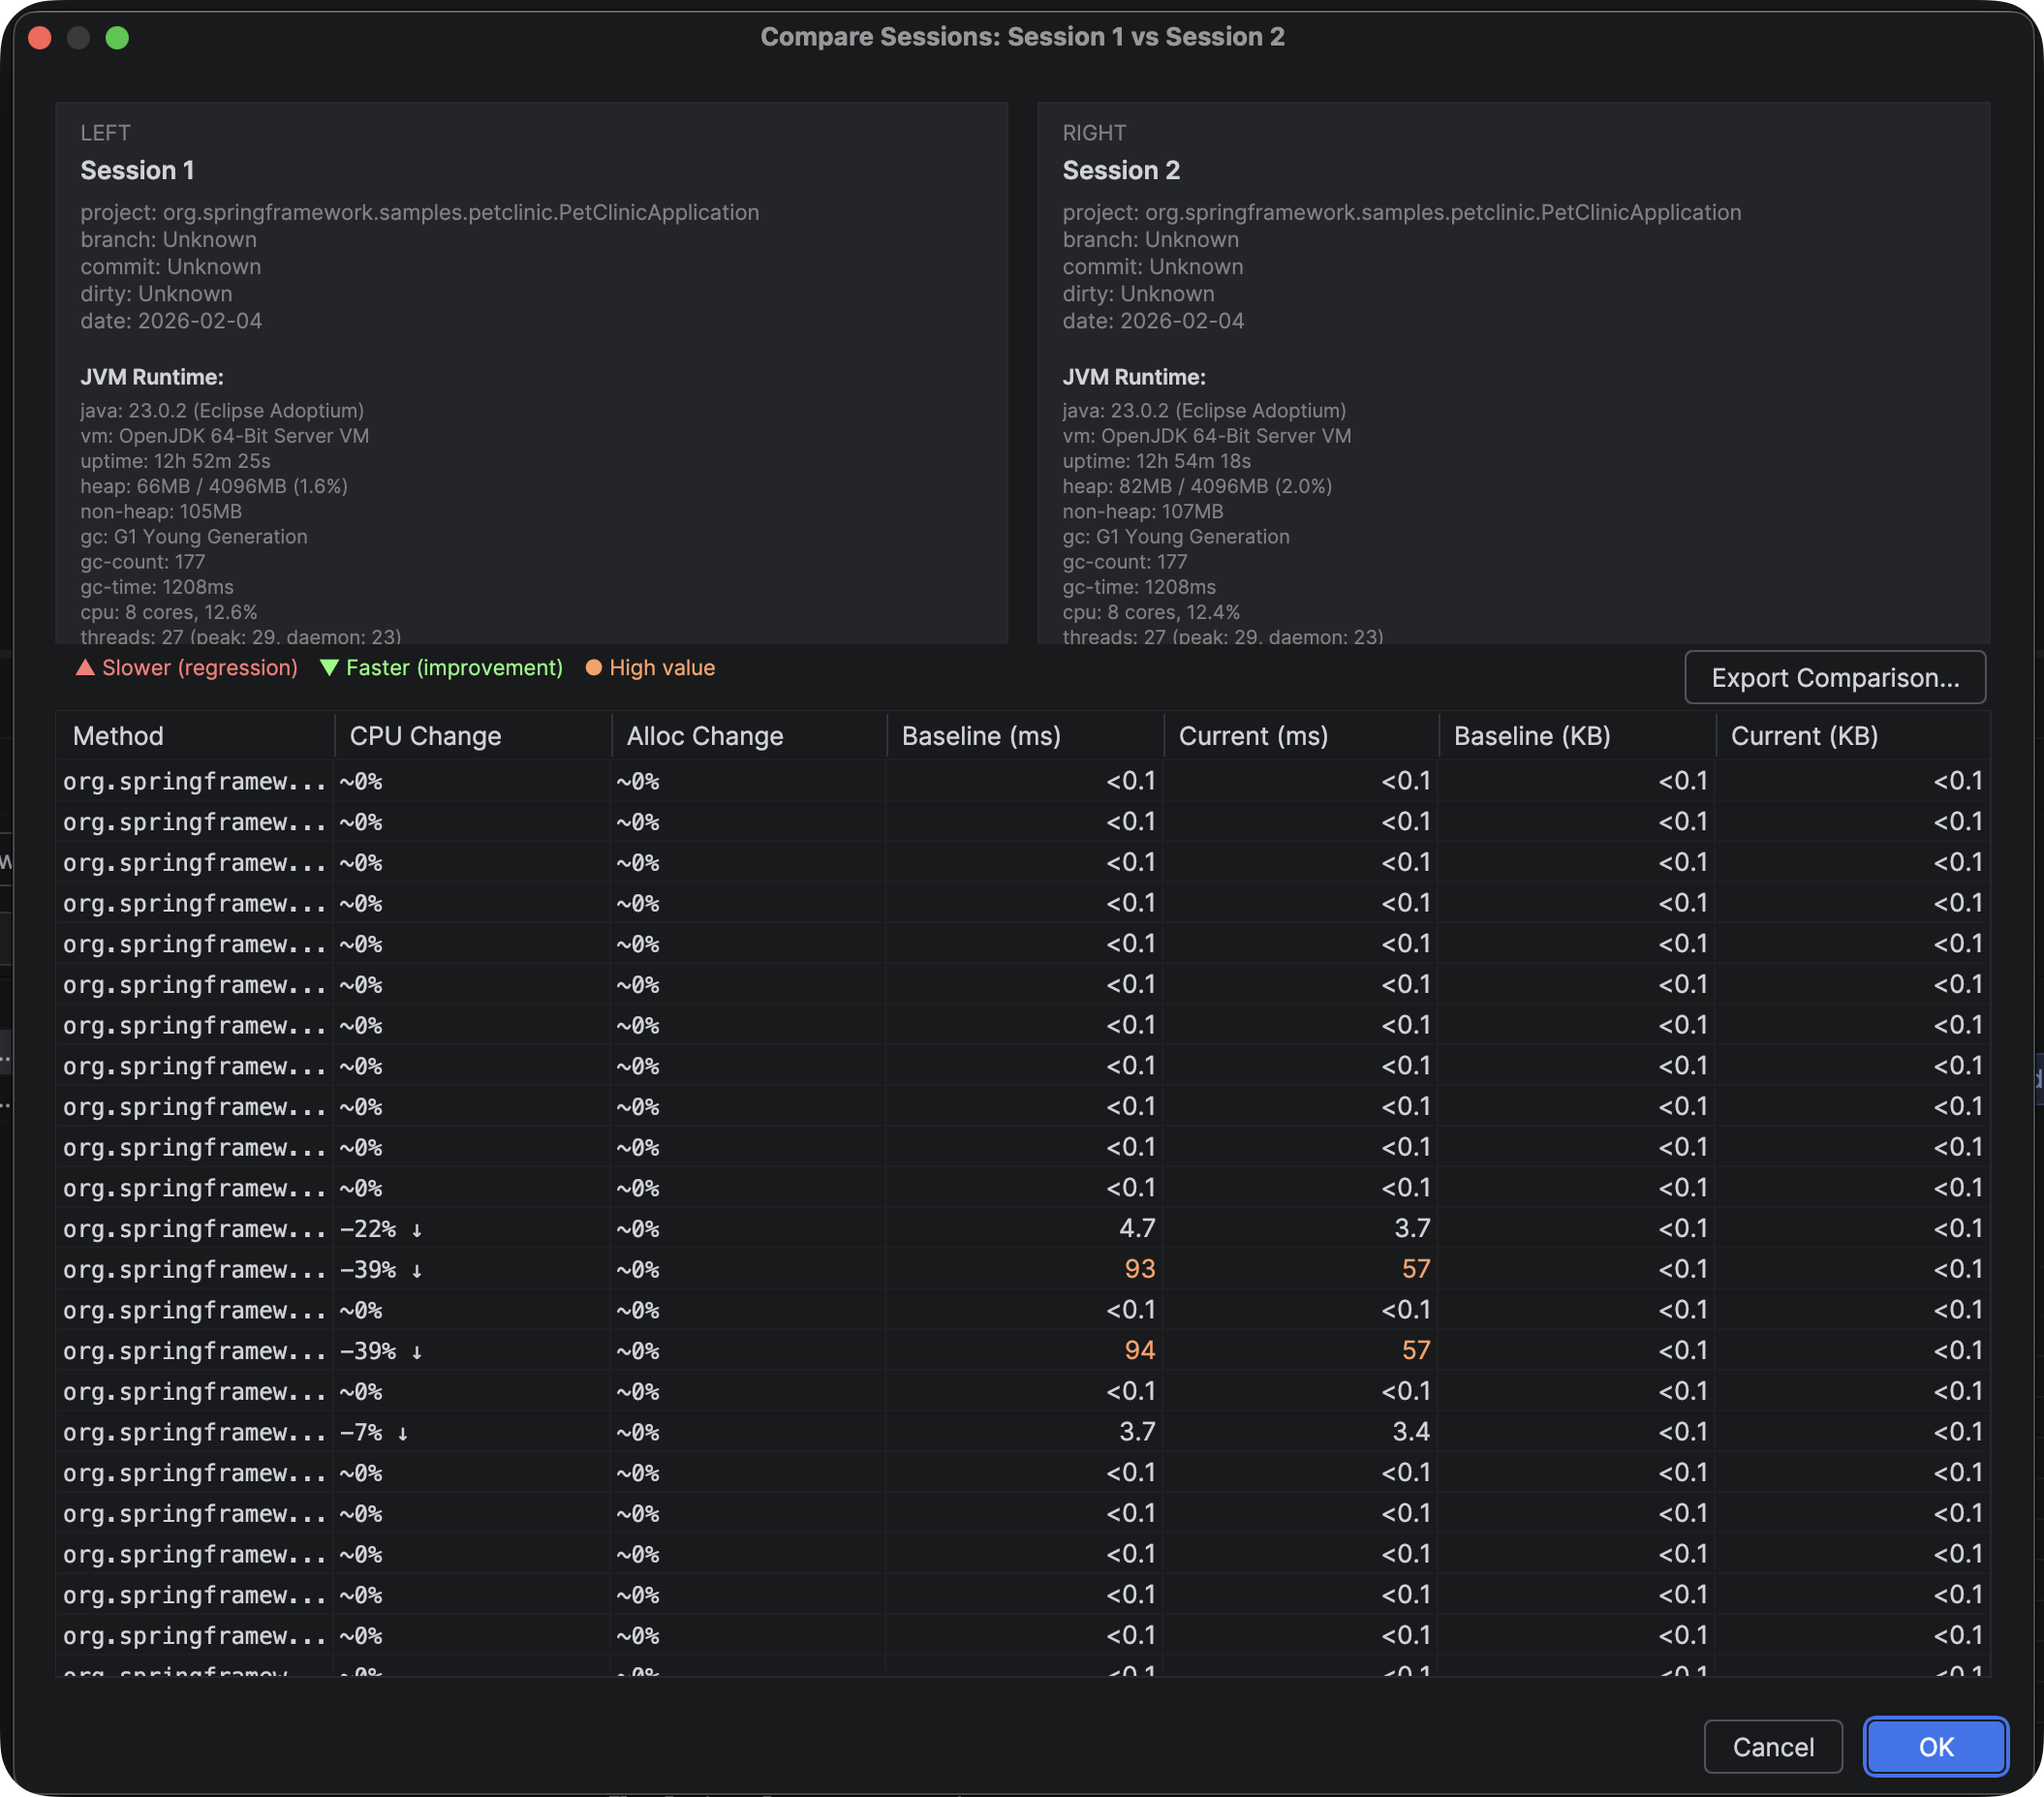
Session Comparison & Baseline Tracking
A single profiling snapshot doesn't tell you if things are getting better or worse. Save sessions, set baselines, and see exactly which methods regressed — and by how much.
- Save and compare profiling sessions
- Baseline tracking with regression detection
- Session history for performance trends
Act
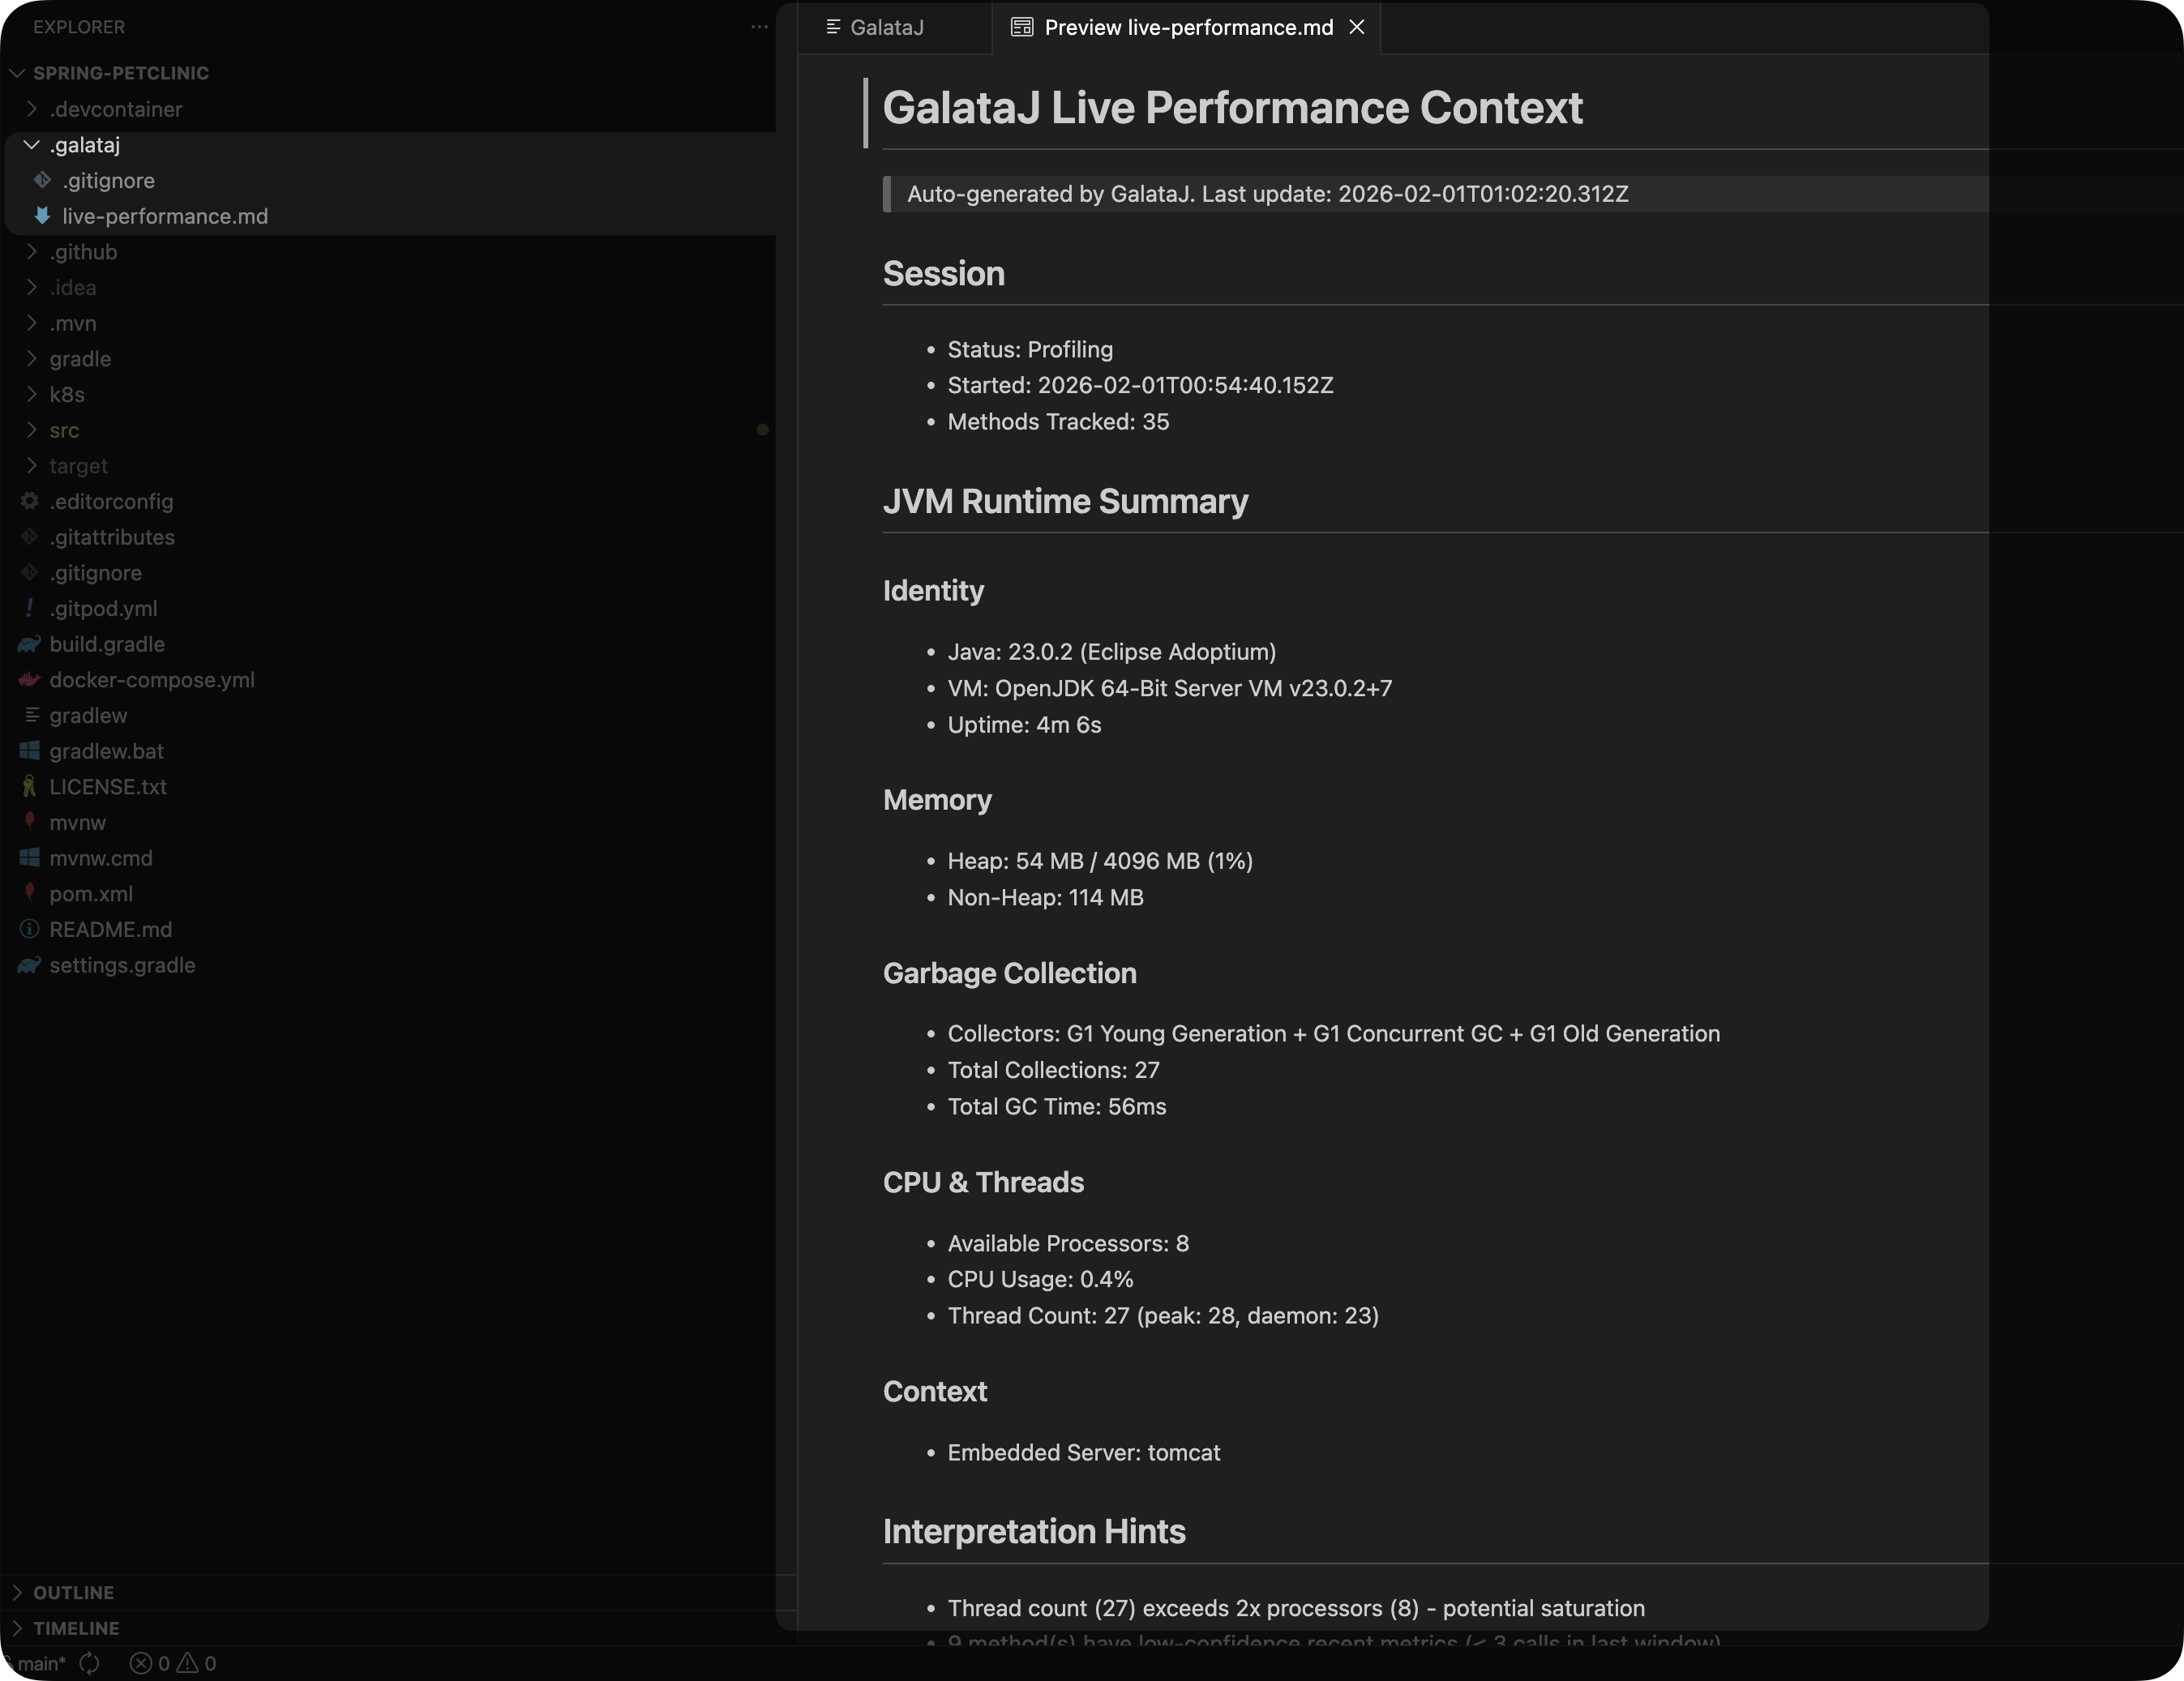
Structured Context Export
Profiling data exports as Markdown files in your project — .galataj/live-performance.md and .galataj/baseline-live-compare.md. Plain text, version-controllable, readable by you, your team, or your tools.
- One-click "Add to Chat" for AI-assisted analysis
- Export to JSON, CSV, and HTML
- Custom prompts for repeatable analysis workflows
What GalataJ Doesn't Do
GalataJ is a developer profiler, not an APM or monitoring tool.
We help you find WHERE the problem is. Understanding WHY is your job.
Roadmap 2026
Upcoming features we're working on.
CI Integration
GalataJ + CI — compare performance across git commits in your pipeline. Catch regressions before they merge.
2026Local MCP Server
AI tools talk with the profiler directly.
2026Agent Skill
AI tools can call GalataJ CLI — run, perform, compare, act.
2026UNDER THE HOOD
Bytecode Instrumentation
Measures method execution time, memory allocation, and call frequency at the bytecode level. ~3% overhead.
Runtime Auto Attach
Attaches to any running JVM process automatically. No application restart, no JVM flags, no setup.
JDK 8+
Compatible with JDK 8, 11, 17, 21 and later. OpenJDK, Oracle JDK, Amazon Corretto. Windows, Linux, macOS.
Frequently Asked Questions
Common questions about functionality and compatibility.