VS Code / Cursor / Windsurf
Veja métricas de desempenho diretamente no seu editor baseado em VS Code.
Funciona com todos os editores baseados em VS Code
Este guia se aplica a VS Code, Cursor e Windsurf — todos usam a mesma extensão.
Instalação
Seção intitulada “Instalação”- Abra Extensões (Ctrl+Shift+X)
- Pesquise por “GalataJ”
- Clique em Instalar
Não precisa reiniciar!
Requisitos
VS Code 1.80 ou posterior
Iniciar Perfilamento
Seção intitulada “Iniciar Perfilamento”- Execute sua aplicação Java
- Abra a Paleta de Comandos (Ctrl+Shift+P)
- Execute “GalataJ: Start Profiling”
- Selecione sua JVM da lista
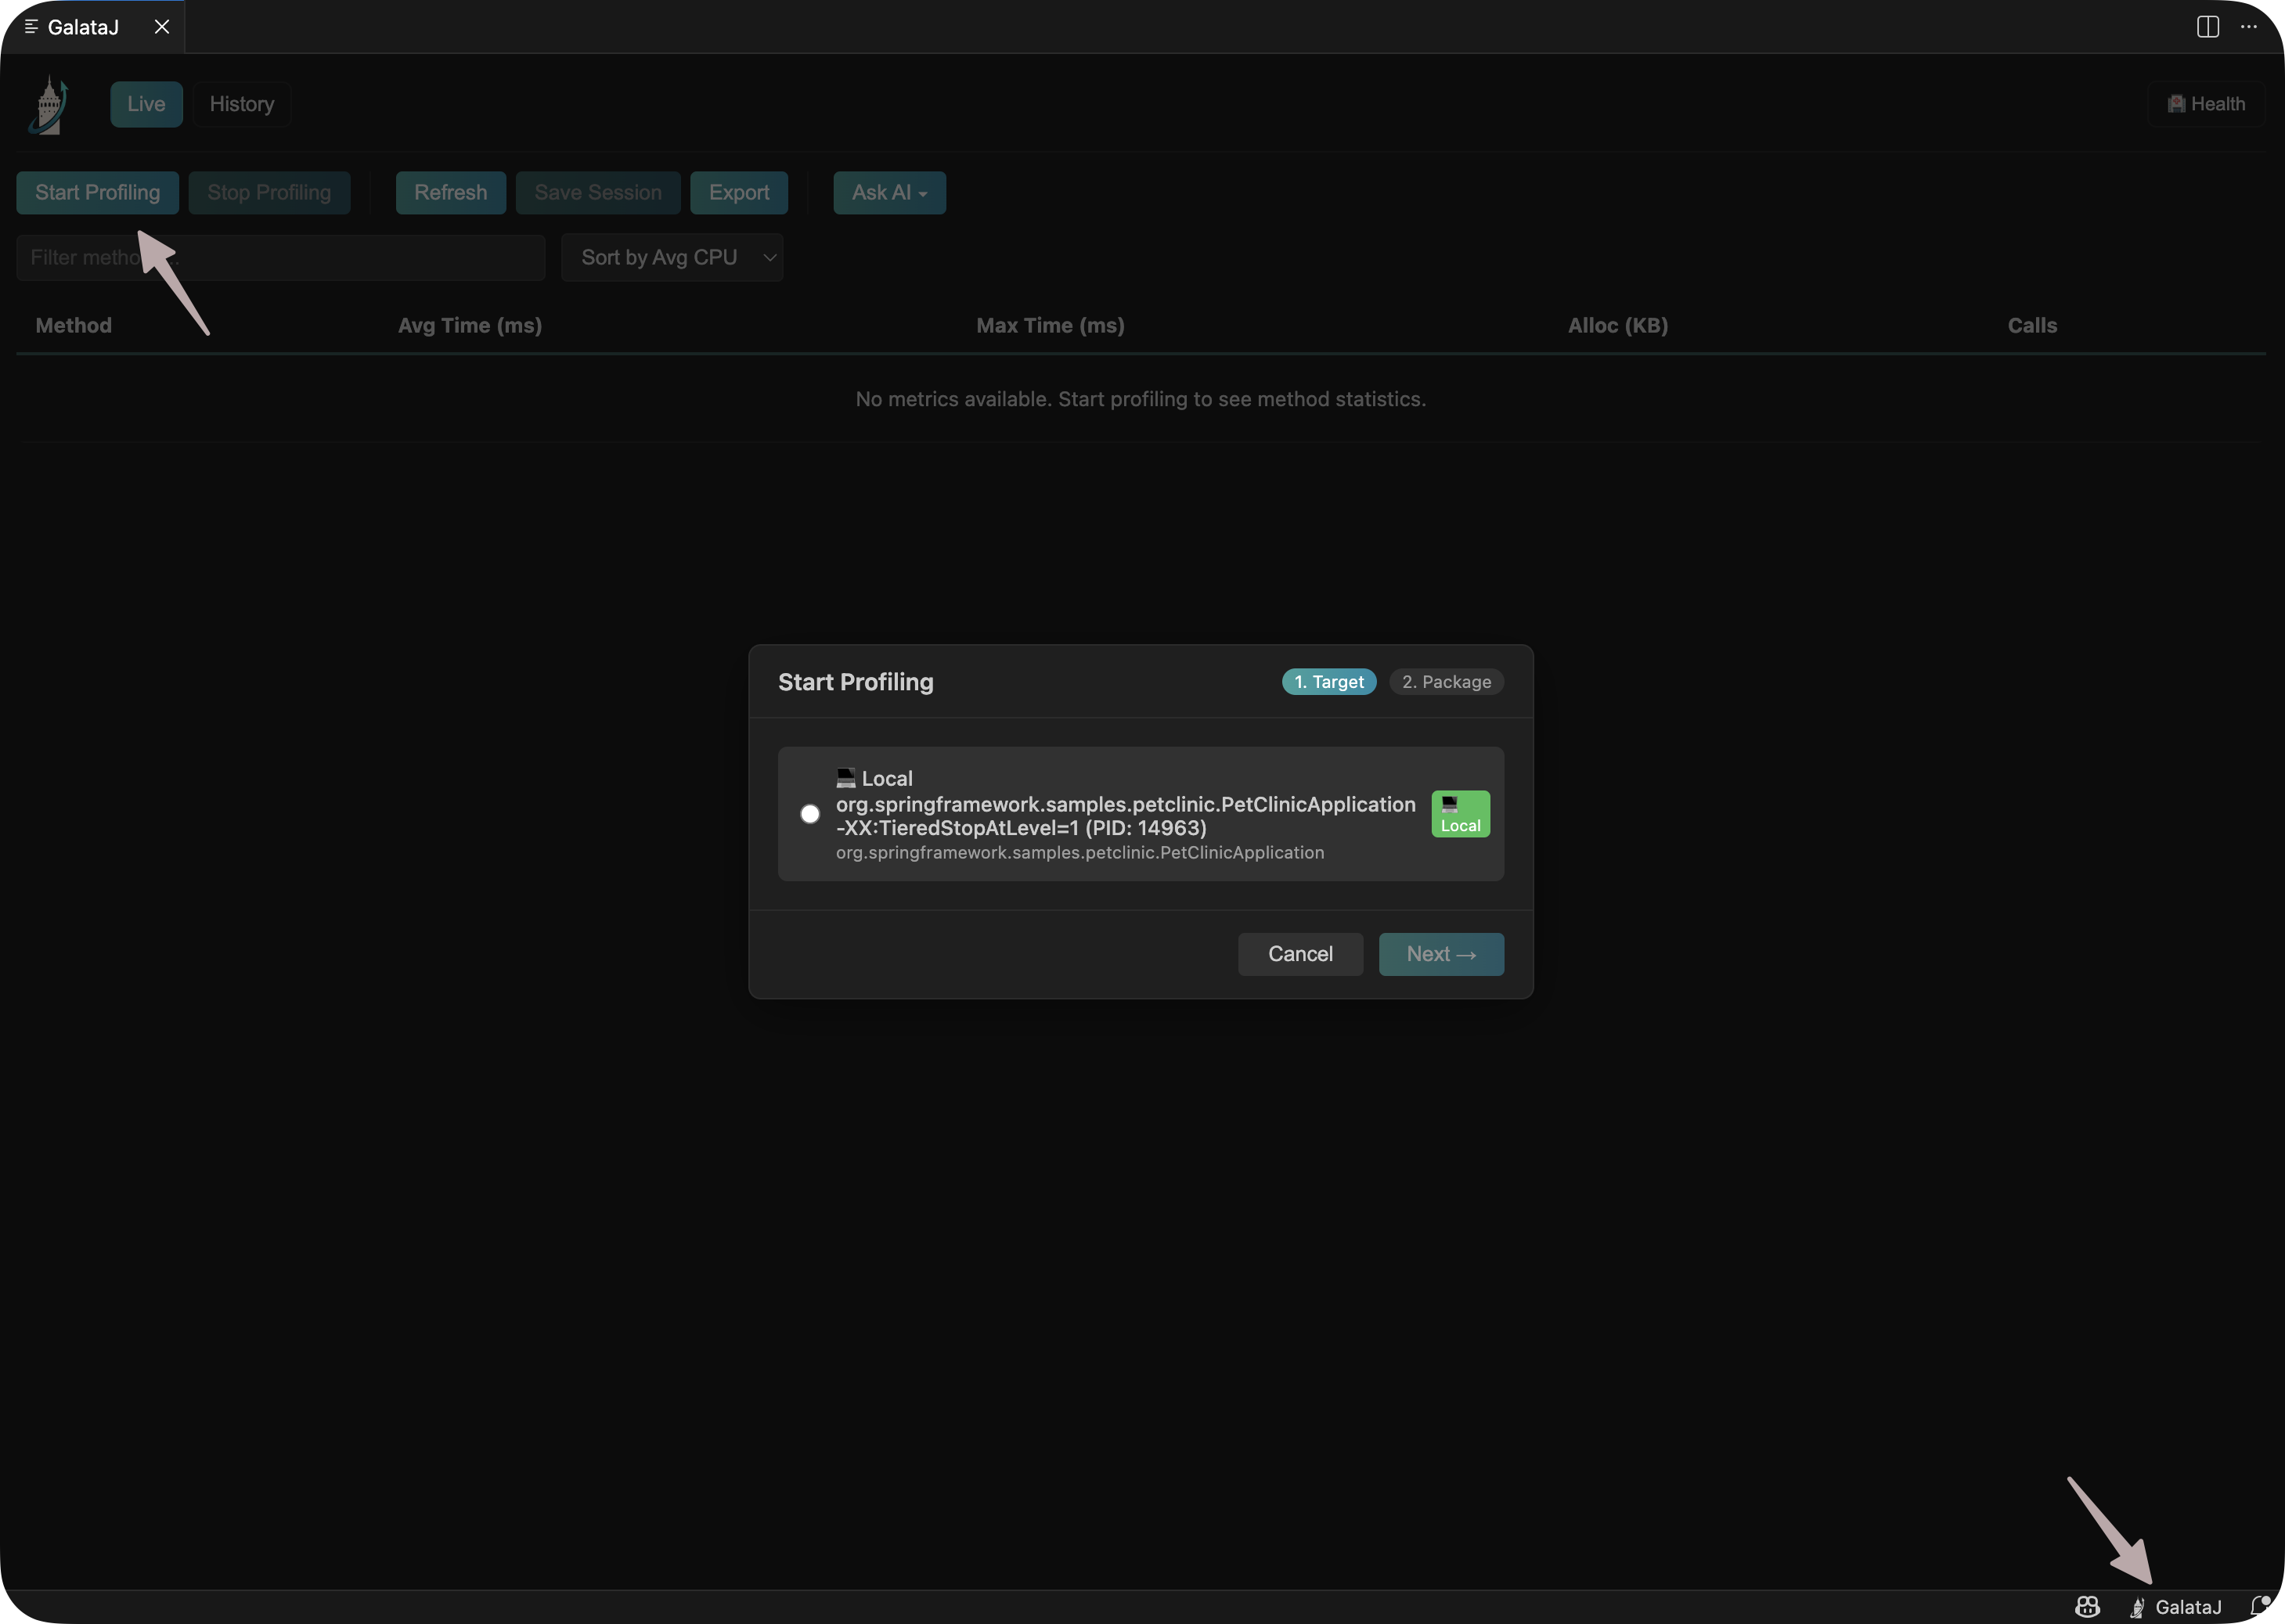
É isso! Métricas aparecerão acima dos seus métodos.
Dicas Inline
Seção intitulada “Dicas Inline”Dados de desempenho aparecem diretamente acima dos seus métodos:
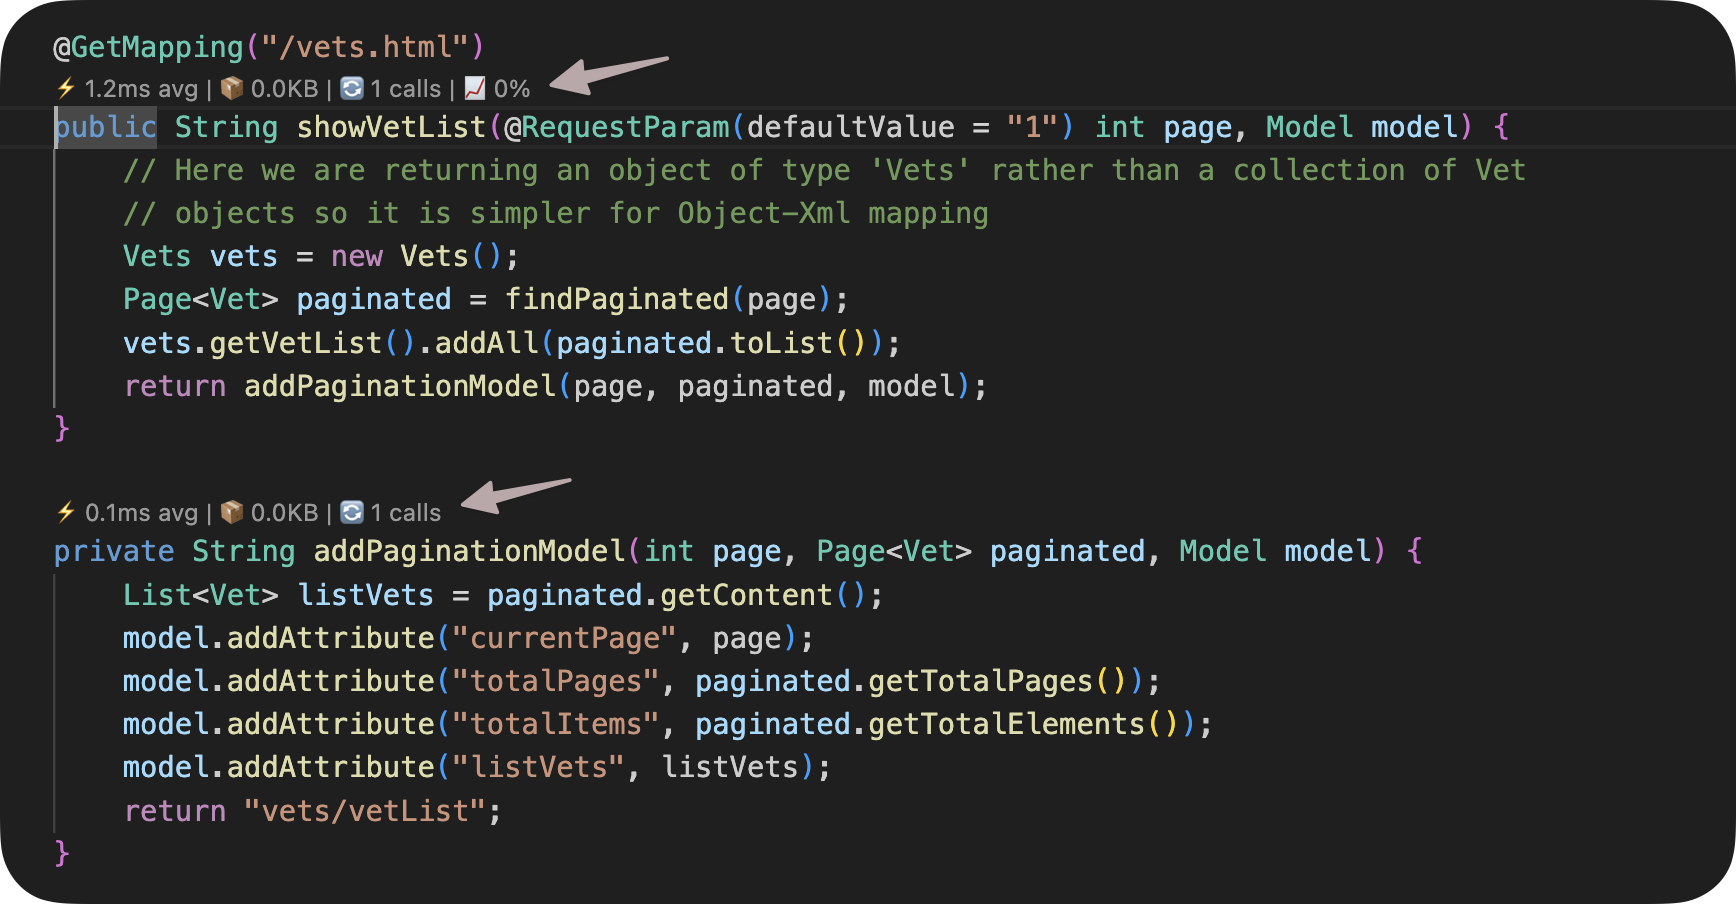
Métricas mostradas:
- Avg — Tempo médio de execução
- Max — Tempo máximo de execução
- Calls — Número de invocações
- Trend — Mudança de desempenho (↑ mais lento, ↓ mais rápido)
Passe o mouse sobre uma dica para mais detalhes.
Parar Perfilamento
Seção intitulada “Parar Perfilamento”Abra a Paleta de Comandos (Ctrl+Shift+P) e execute “GalataJ: Stop Profiling”
Configurações
Seção intitulada “Configurações”Abra Configurações e pesquise por “GalataJ” para personalizar:
- Mostrar/ocultar dicas inline
- Iniciar controlador automaticamente
- Intervalo de atualização
Solução de Problemas
Seção intitulada “Solução de Problemas”JVM não aparece
Seção intitulada “JVM não aparece”Execute “GalataJ: Refresh JVMs” da Paleta de Comandos. Certifique-se de que sua aplicação Java está em execução.
Sem métricas
Seção intitulada “Sem métricas”- Verifique se a barra de status mostra “GalataJ: Connected”
- Abra arquivos do pacote perfilado
- Aguarde alguns segundos para os dados chegarem
Extensão não ativa
Seção intitulada “Extensão não ativa”Recarregar janela: Paleta de Comandos → “Developer: Reload Window”
Precisa de mais ajuda?
Seção intitulada “Precisa de mais ajuda?”Execute “GalataJ: Health Check” da Paleta de Comandos.