VS Code / Cursor / Windsurf
अपने VS Code आधारित एडिटर में सीधे प्रदर्शन मेट्रिक्स देखें।
सभी VS Code आधारित एडिटर्स के साथ काम करता है
यह गाइड VS Code, Cursor और Windsurf पर लागू होती है — ये सभी एक ही एक्सटेंशन का उपयोग करते हैं।
इंस्टॉलेशन
Section titled “इंस्टॉलेशन”- एक्सटेंशन्स खोलें (Ctrl+Shift+X)
- “GalataJ” खोजें
- इंस्टॉल पर क्लिक करें
रीस्टार्ट की जरूरत नहीं!
आवश्यकताएं
VS Code 1.80 या बाद का संस्करण
प्रोफाइलिंग शुरू करें
Section titled “प्रोफाइलिंग शुरू करें”- अपनी Java एप्लिकेशन चलाएं
- कमांड पैलेट खोलें (Ctrl+Shift+P)
- “GalataJ: Start Profiling” चलाएं
- सूची से अपनी JVM चुनें
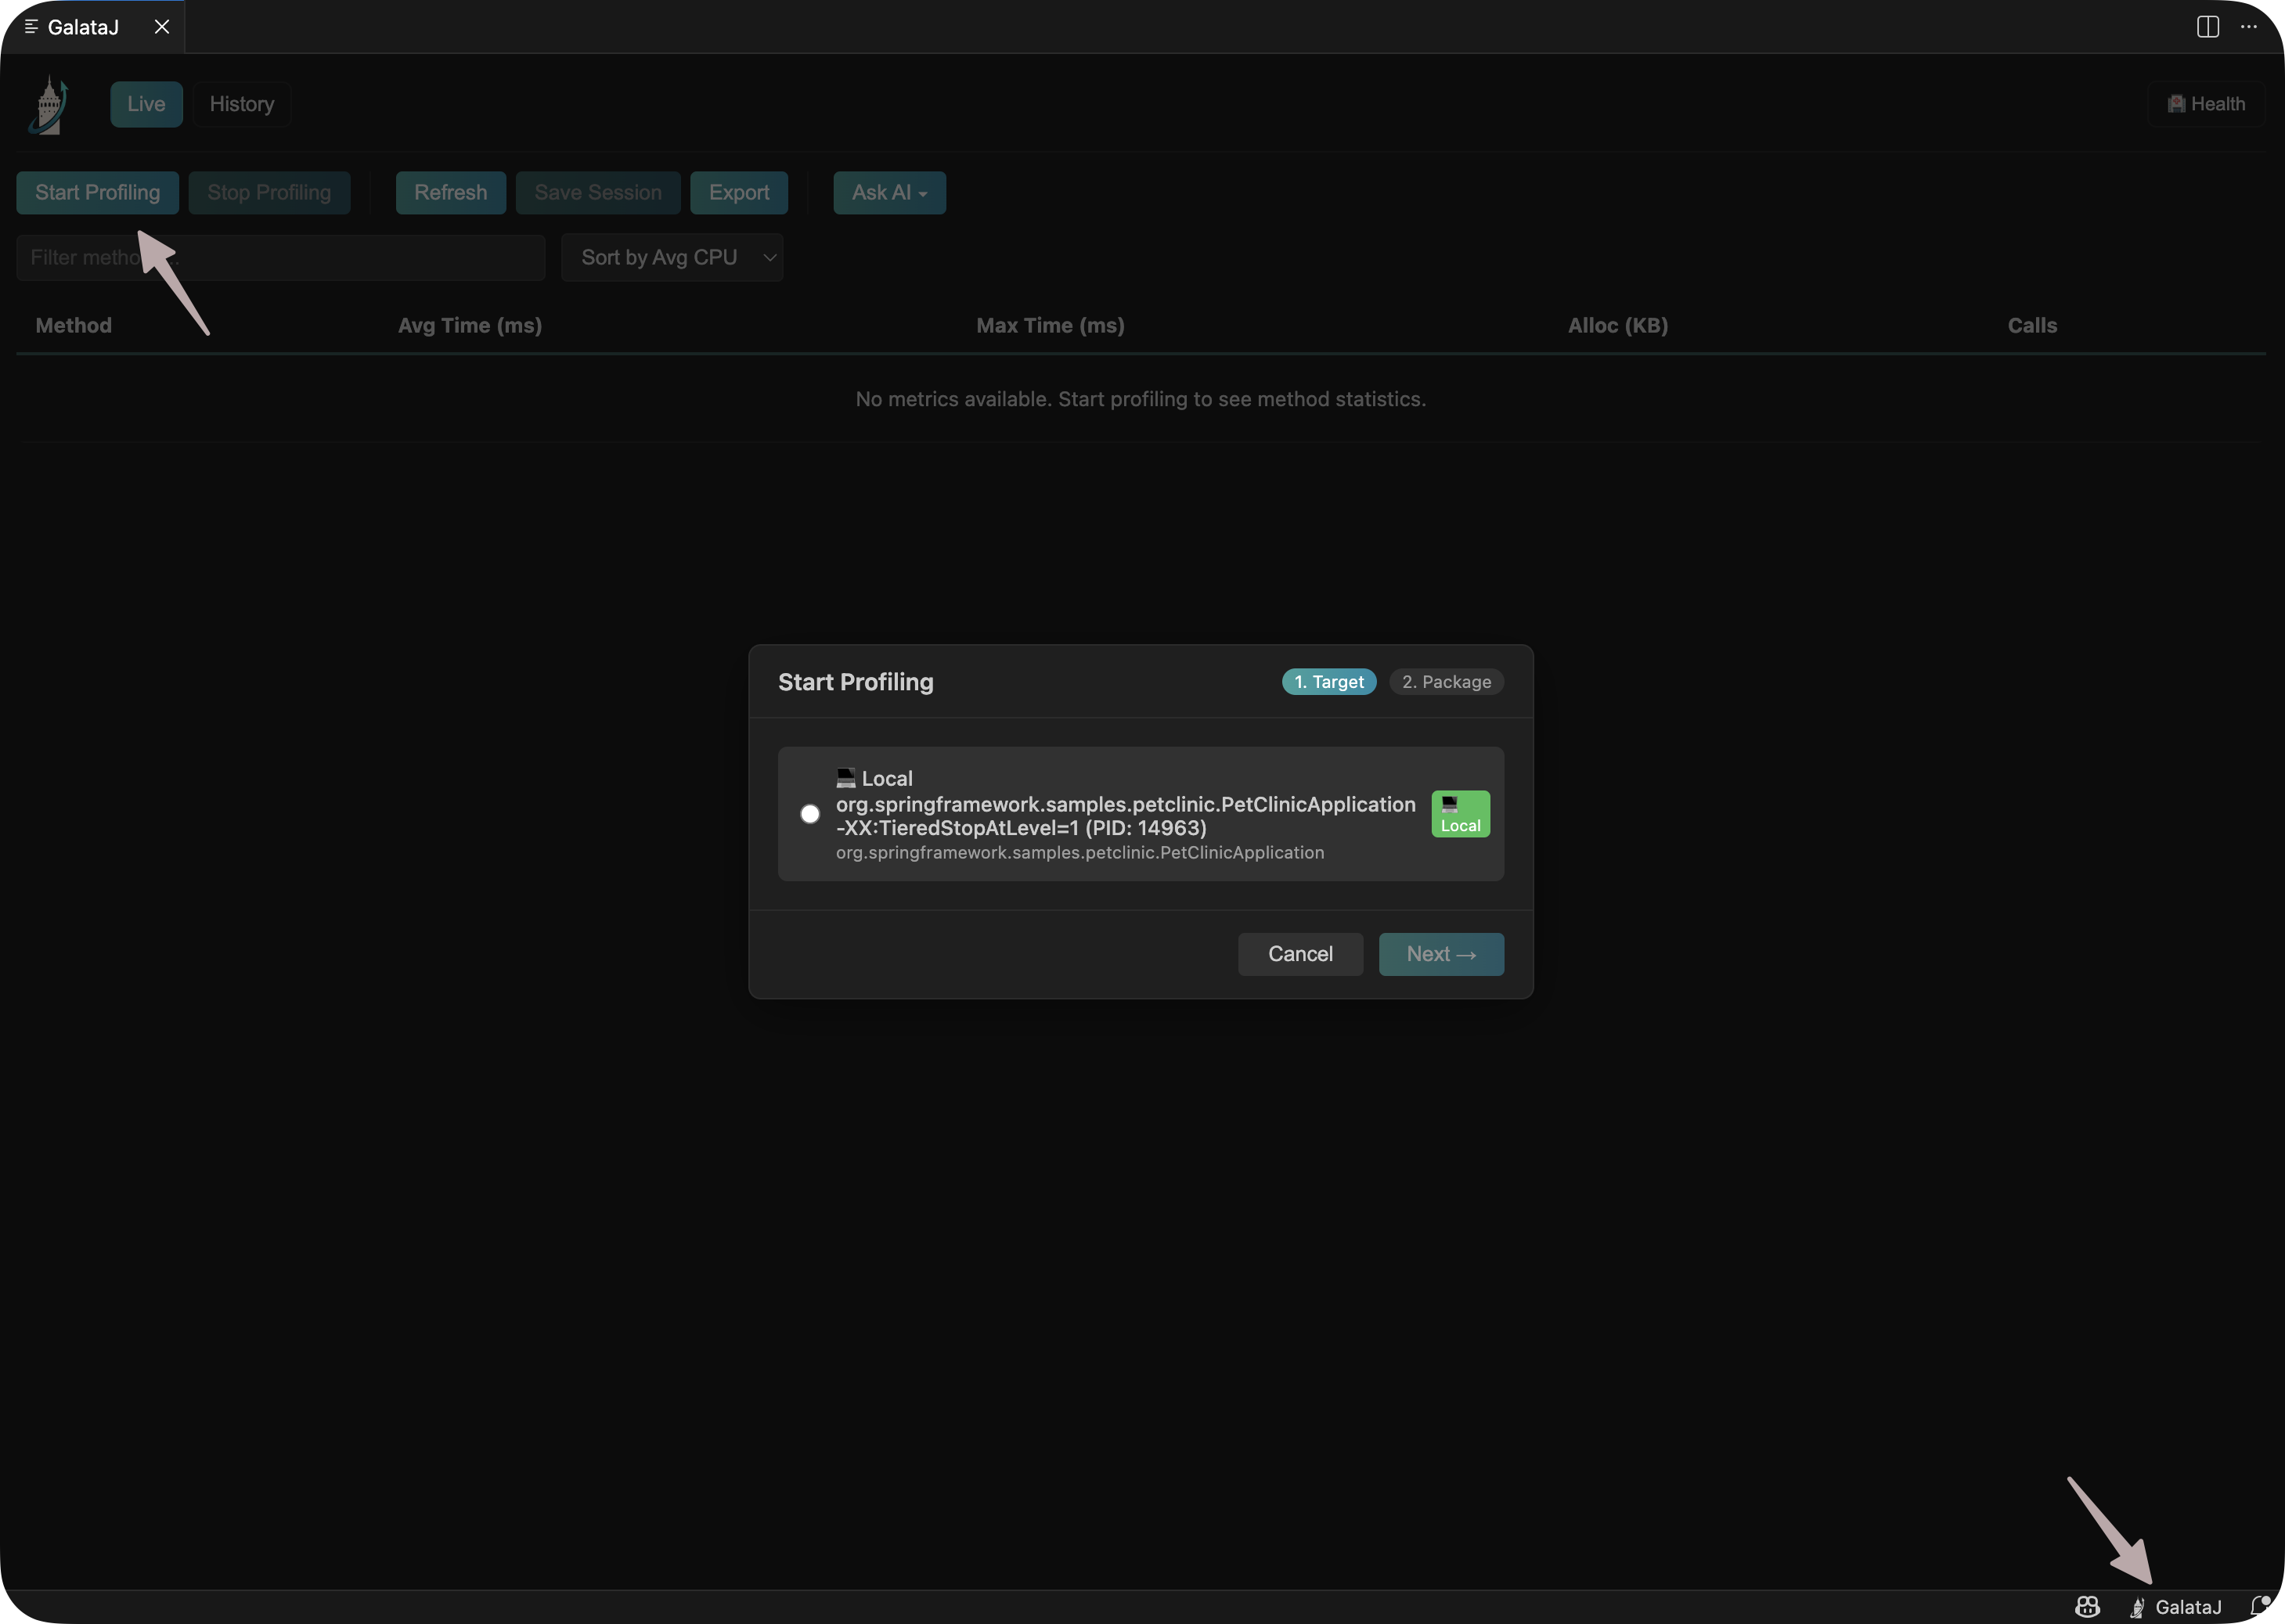
बस इतना ही! मेट्रिक्स आपके मेथड्स के ऊपर दिखाई देंगी।
इनलाइन हिंट्स
Section titled “इनलाइन हिंट्स”प्रदर्शन डेटा सीधे आपके मेथड्स के ऊपर दिखाई देता है:
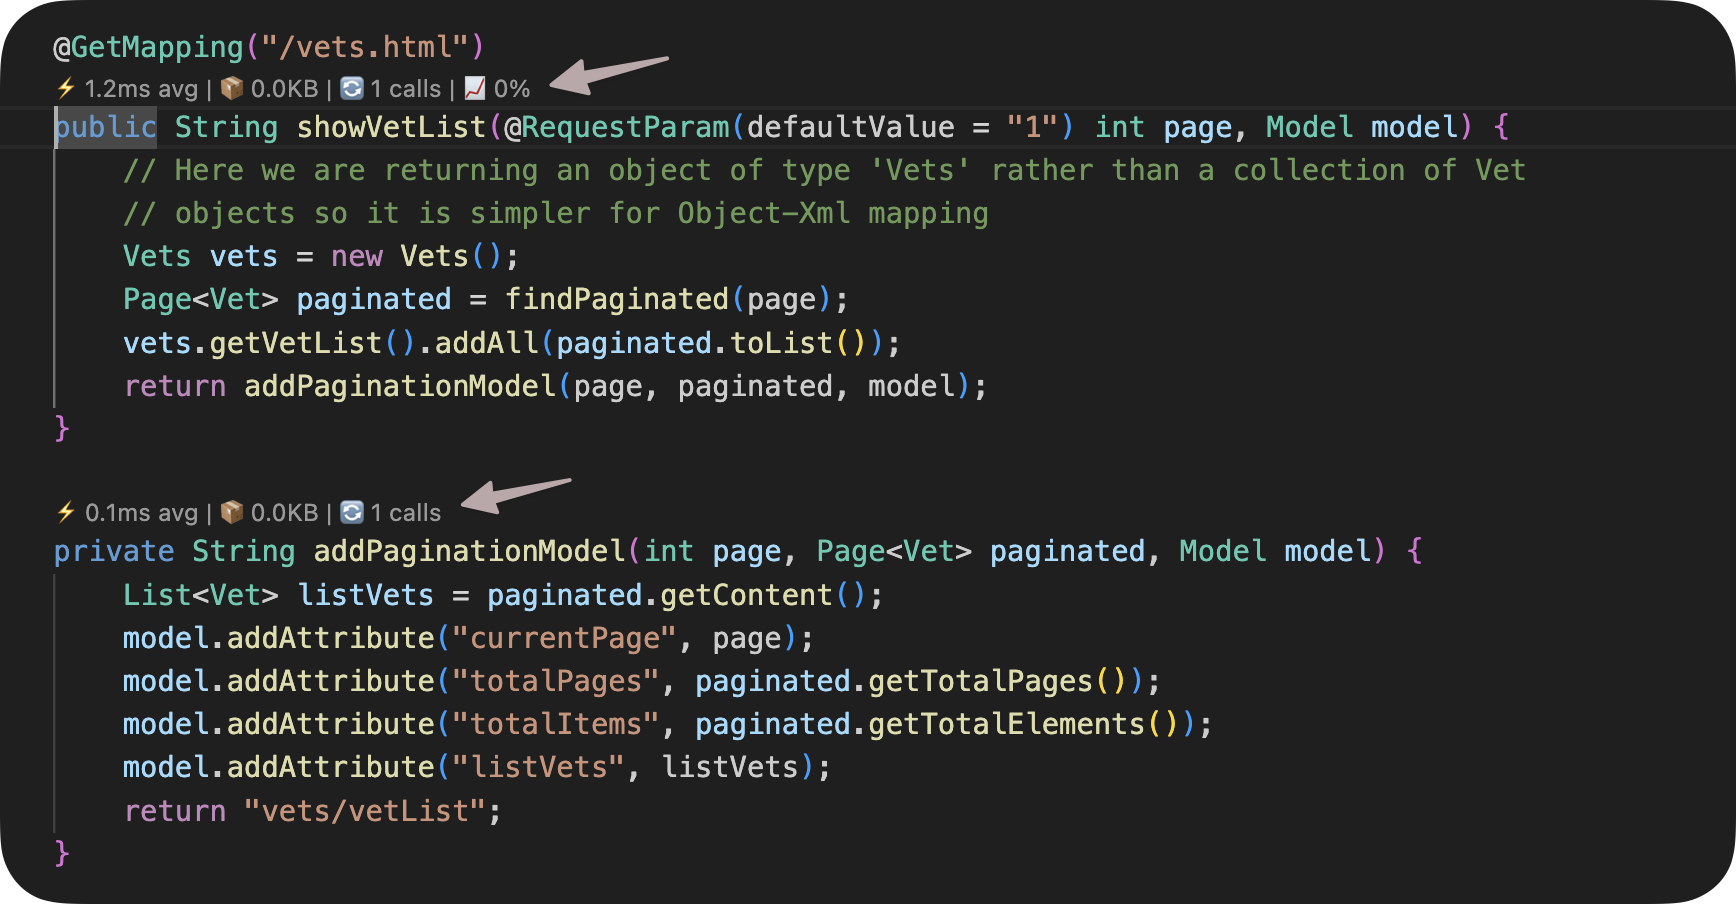
दिखाई गई मेट्रिक्स:
- Avg — औसत निष्पादन समय
- Max — अधिकतम निष्पादन समय
- Calls — आह्वान की संख्या
- Trend — प्रदर्शन परिवर्तन (↑ धीमा, ↓ तेज)
अधिक विवरण के लिए हिंट पर होवर करें।
प्रोफाइलिंग रोकें
Section titled “प्रोफाइलिंग रोकें”कमांड पैलेट खोलें (Ctrl+Shift+P) और “GalataJ: Stop Profiling” चलाएं
सेटिंग्स
Section titled “सेटिंग्स”सेटिंग्स खोलें और कस्टमाइज करने के लिए “GalataJ” खोजें:
- इनलाइन हिंट्स दिखाएं/छुपाएं
- कंट्रोलर ऑटो-स्टार्ट करें
- अपडेट इंटरवल
समस्या निवारण
Section titled “समस्या निवारण”JVM दिखाई नहीं दे रही
Section titled “JVM दिखाई नहीं दे रही”कमांड पैलेट से “GalataJ: Refresh JVMs” चलाएं। सुनिश्चित करें कि आपकी Java ऐप चल रही है।
कोई मेट्रिक्स नहीं दिख रही
Section titled “कोई मेट्रिक्स नहीं दिख रही”- जांचें कि स्टेटस बार “GalataJ: Connected” दिखाता है
- प्रोफाइल किए गए पैकेज से फाइलें खोलें
- डेटा आने के लिए कुछ सेकंड प्रतीक्षा करें
एक्सटेंशन सक्रिय नहीं हो रहा
Section titled “एक्सटेंशन सक्रिय नहीं हो रहा”विंडो रीलोड करें: कमांड पैलेट → “Developer: Reload Window”
अधिक सहायता चाहिए?
Section titled “अधिक सहायता चाहिए?”कमांड पैलेट से “GalataJ: Health Check” चलाएं।