Session History
Pro Feature
Session management requires a Pro license. Free tier allows 1 session save per day.
Save your profiling data, set baselines, and compare performance over time.
Why Save Sessions?
Section titled “Why Save Sessions?”- Track changes — See how performance changes after code updates
- Set baselines — Compare current performance against a known-good state
- Detect regressions — Catch slowdowns before they reach production
- Document improvements — Prove your optimizations worked
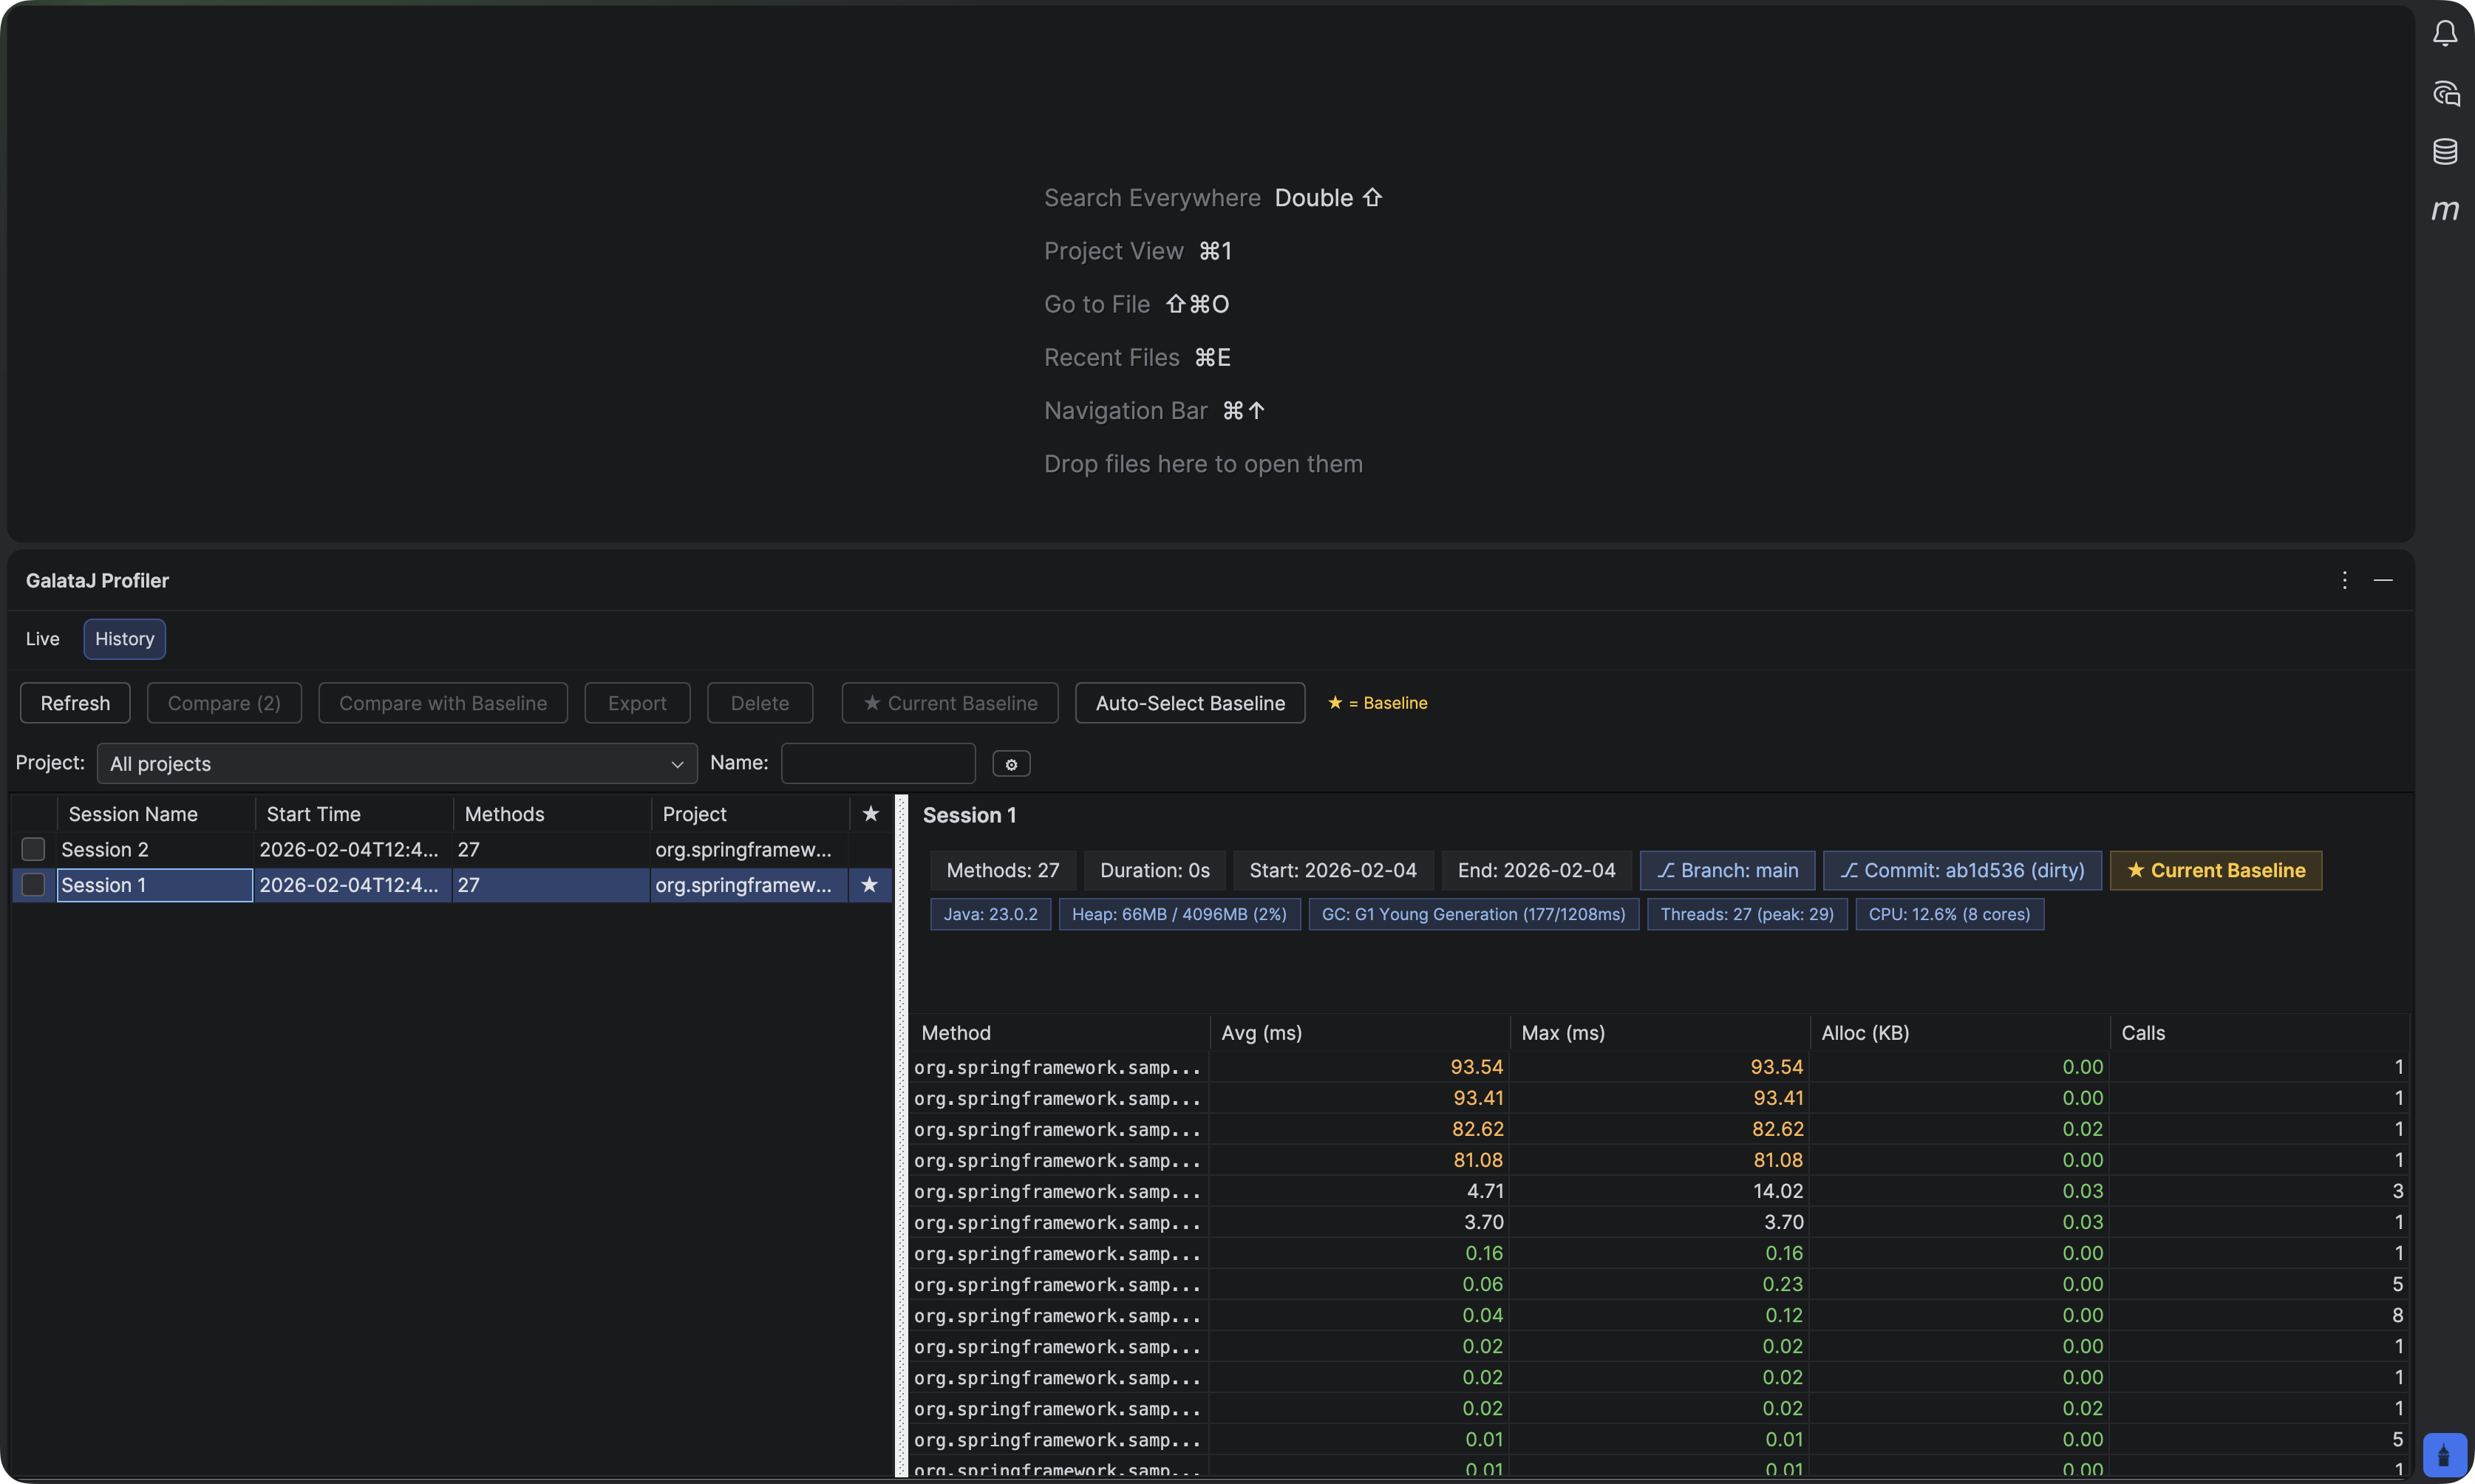
Opening History Panel
Section titled “Opening History Panel”IntelliJ IDEA
Section titled “IntelliJ IDEA”- Open the Profiler panel
- Click the History tab
VS Code / Cursor / Windsurf
Section titled “VS Code / Cursor / Windsurf”- Open the GalataJ sidebar
- Expand Session History section
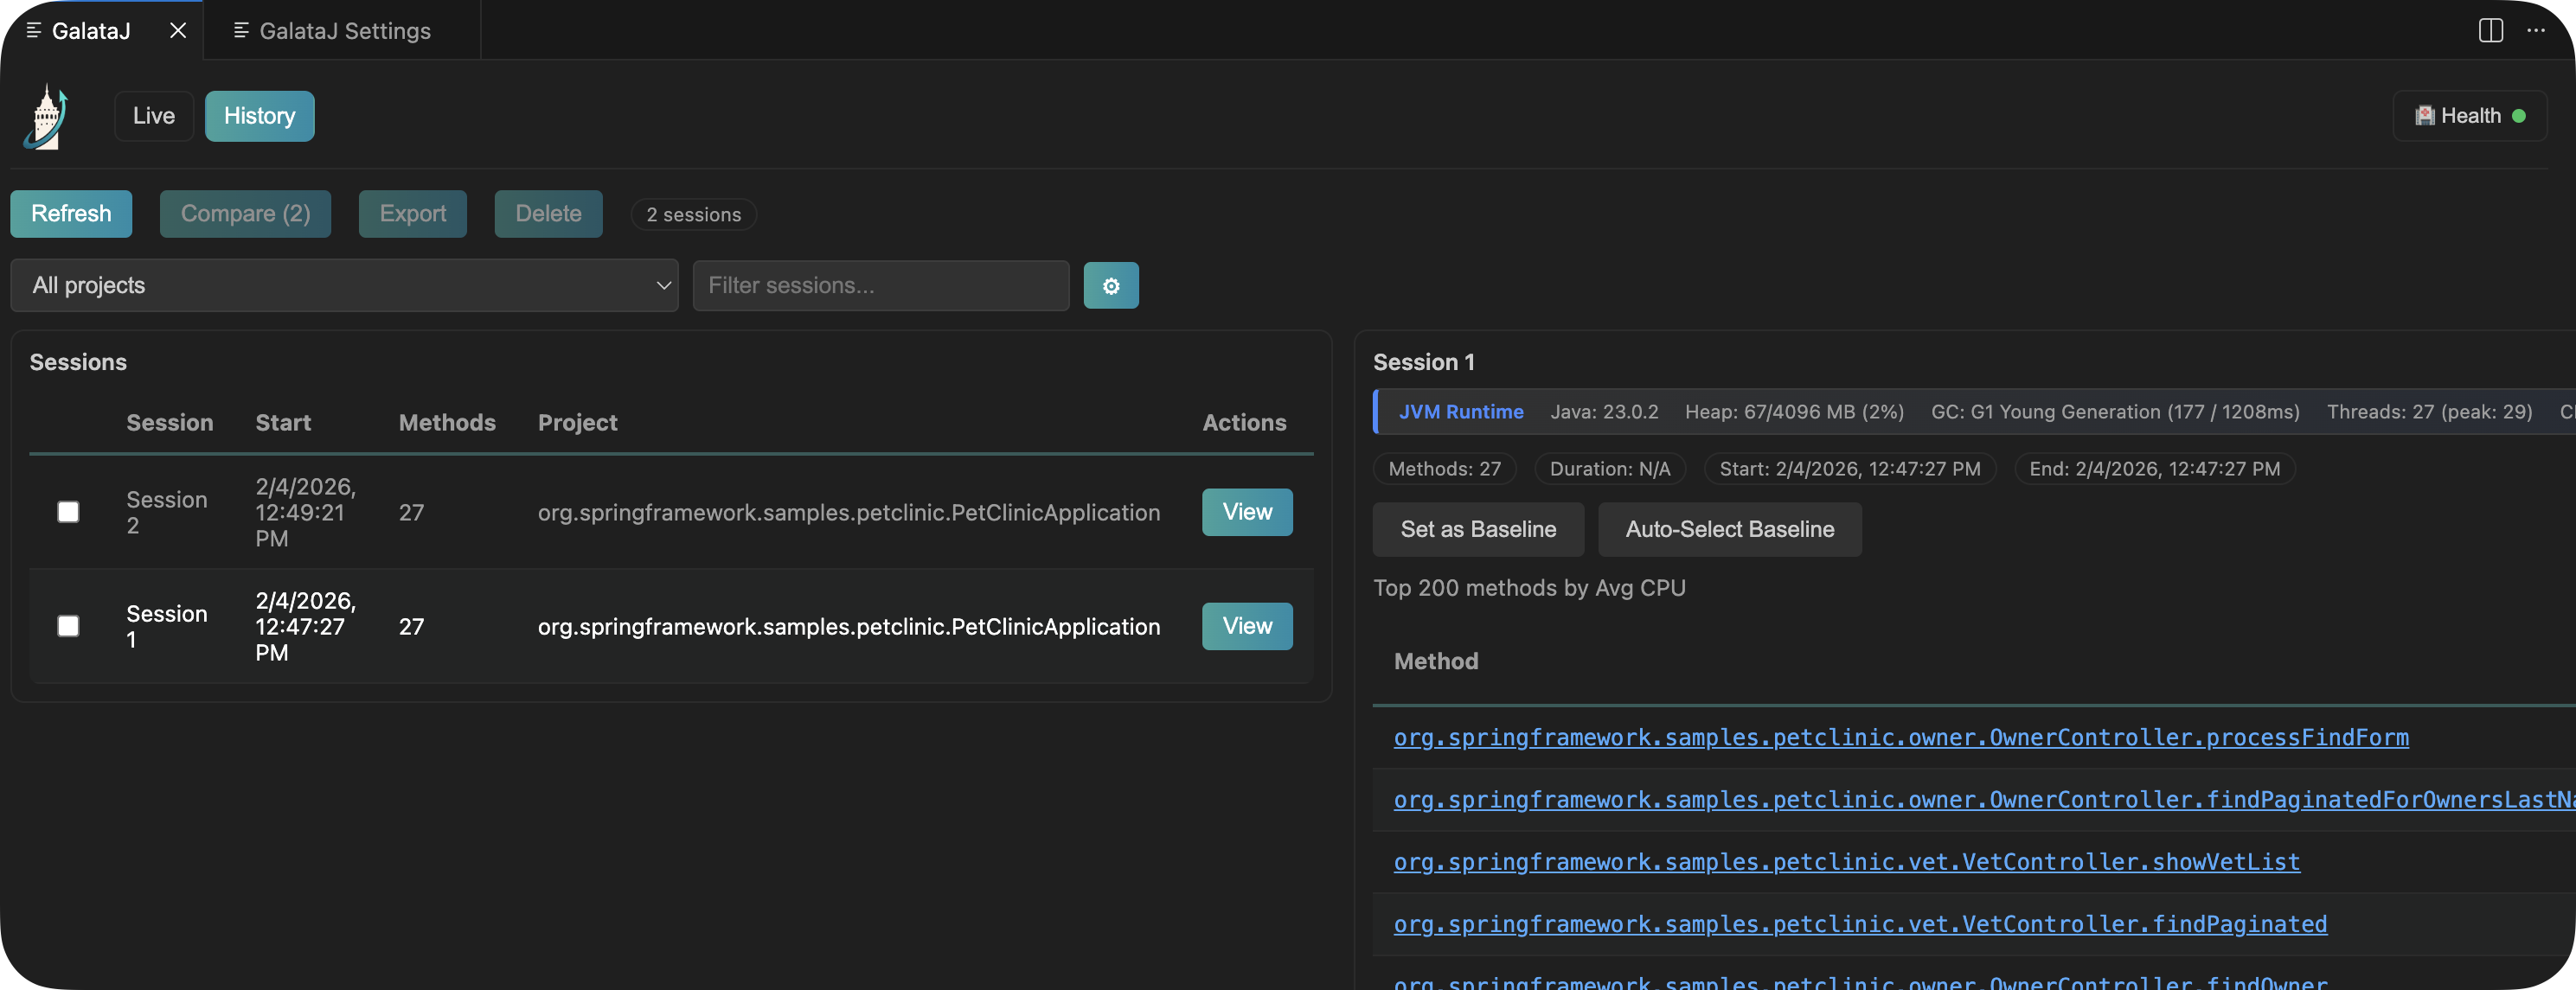
Saving a Session
Section titled “Saving a Session”- While profiling, click Save Session
- Enter a name (e.g., “Before optimization”, “v2.1.0”)
- Click Save
What gets saved:
- All method metrics (avg, max, calls, allocations)
- JVM information
- Timestamp
- Context detection data
Setting a Baseline
Section titled “Setting a Baseline”A baseline is your reference point for comparison. Set it to a known-good performance state.
- Find a session in the history
- Right-click → Set as Baseline (or click the ⭐ icon)
When to set a baseline:
- After a successful release
- Before starting optimization work
- At the start of a sprint
Comparing Sessions
Section titled “Comparing Sessions”See what changed between two sessions.
Compare Any Two Sessions
Section titled “Compare Any Two Sessions”You can also compare any two sessions directly:
- Select the first session
- Hold Ctrl (or Cmd on Mac) and select the second session
- Click Compare Selected
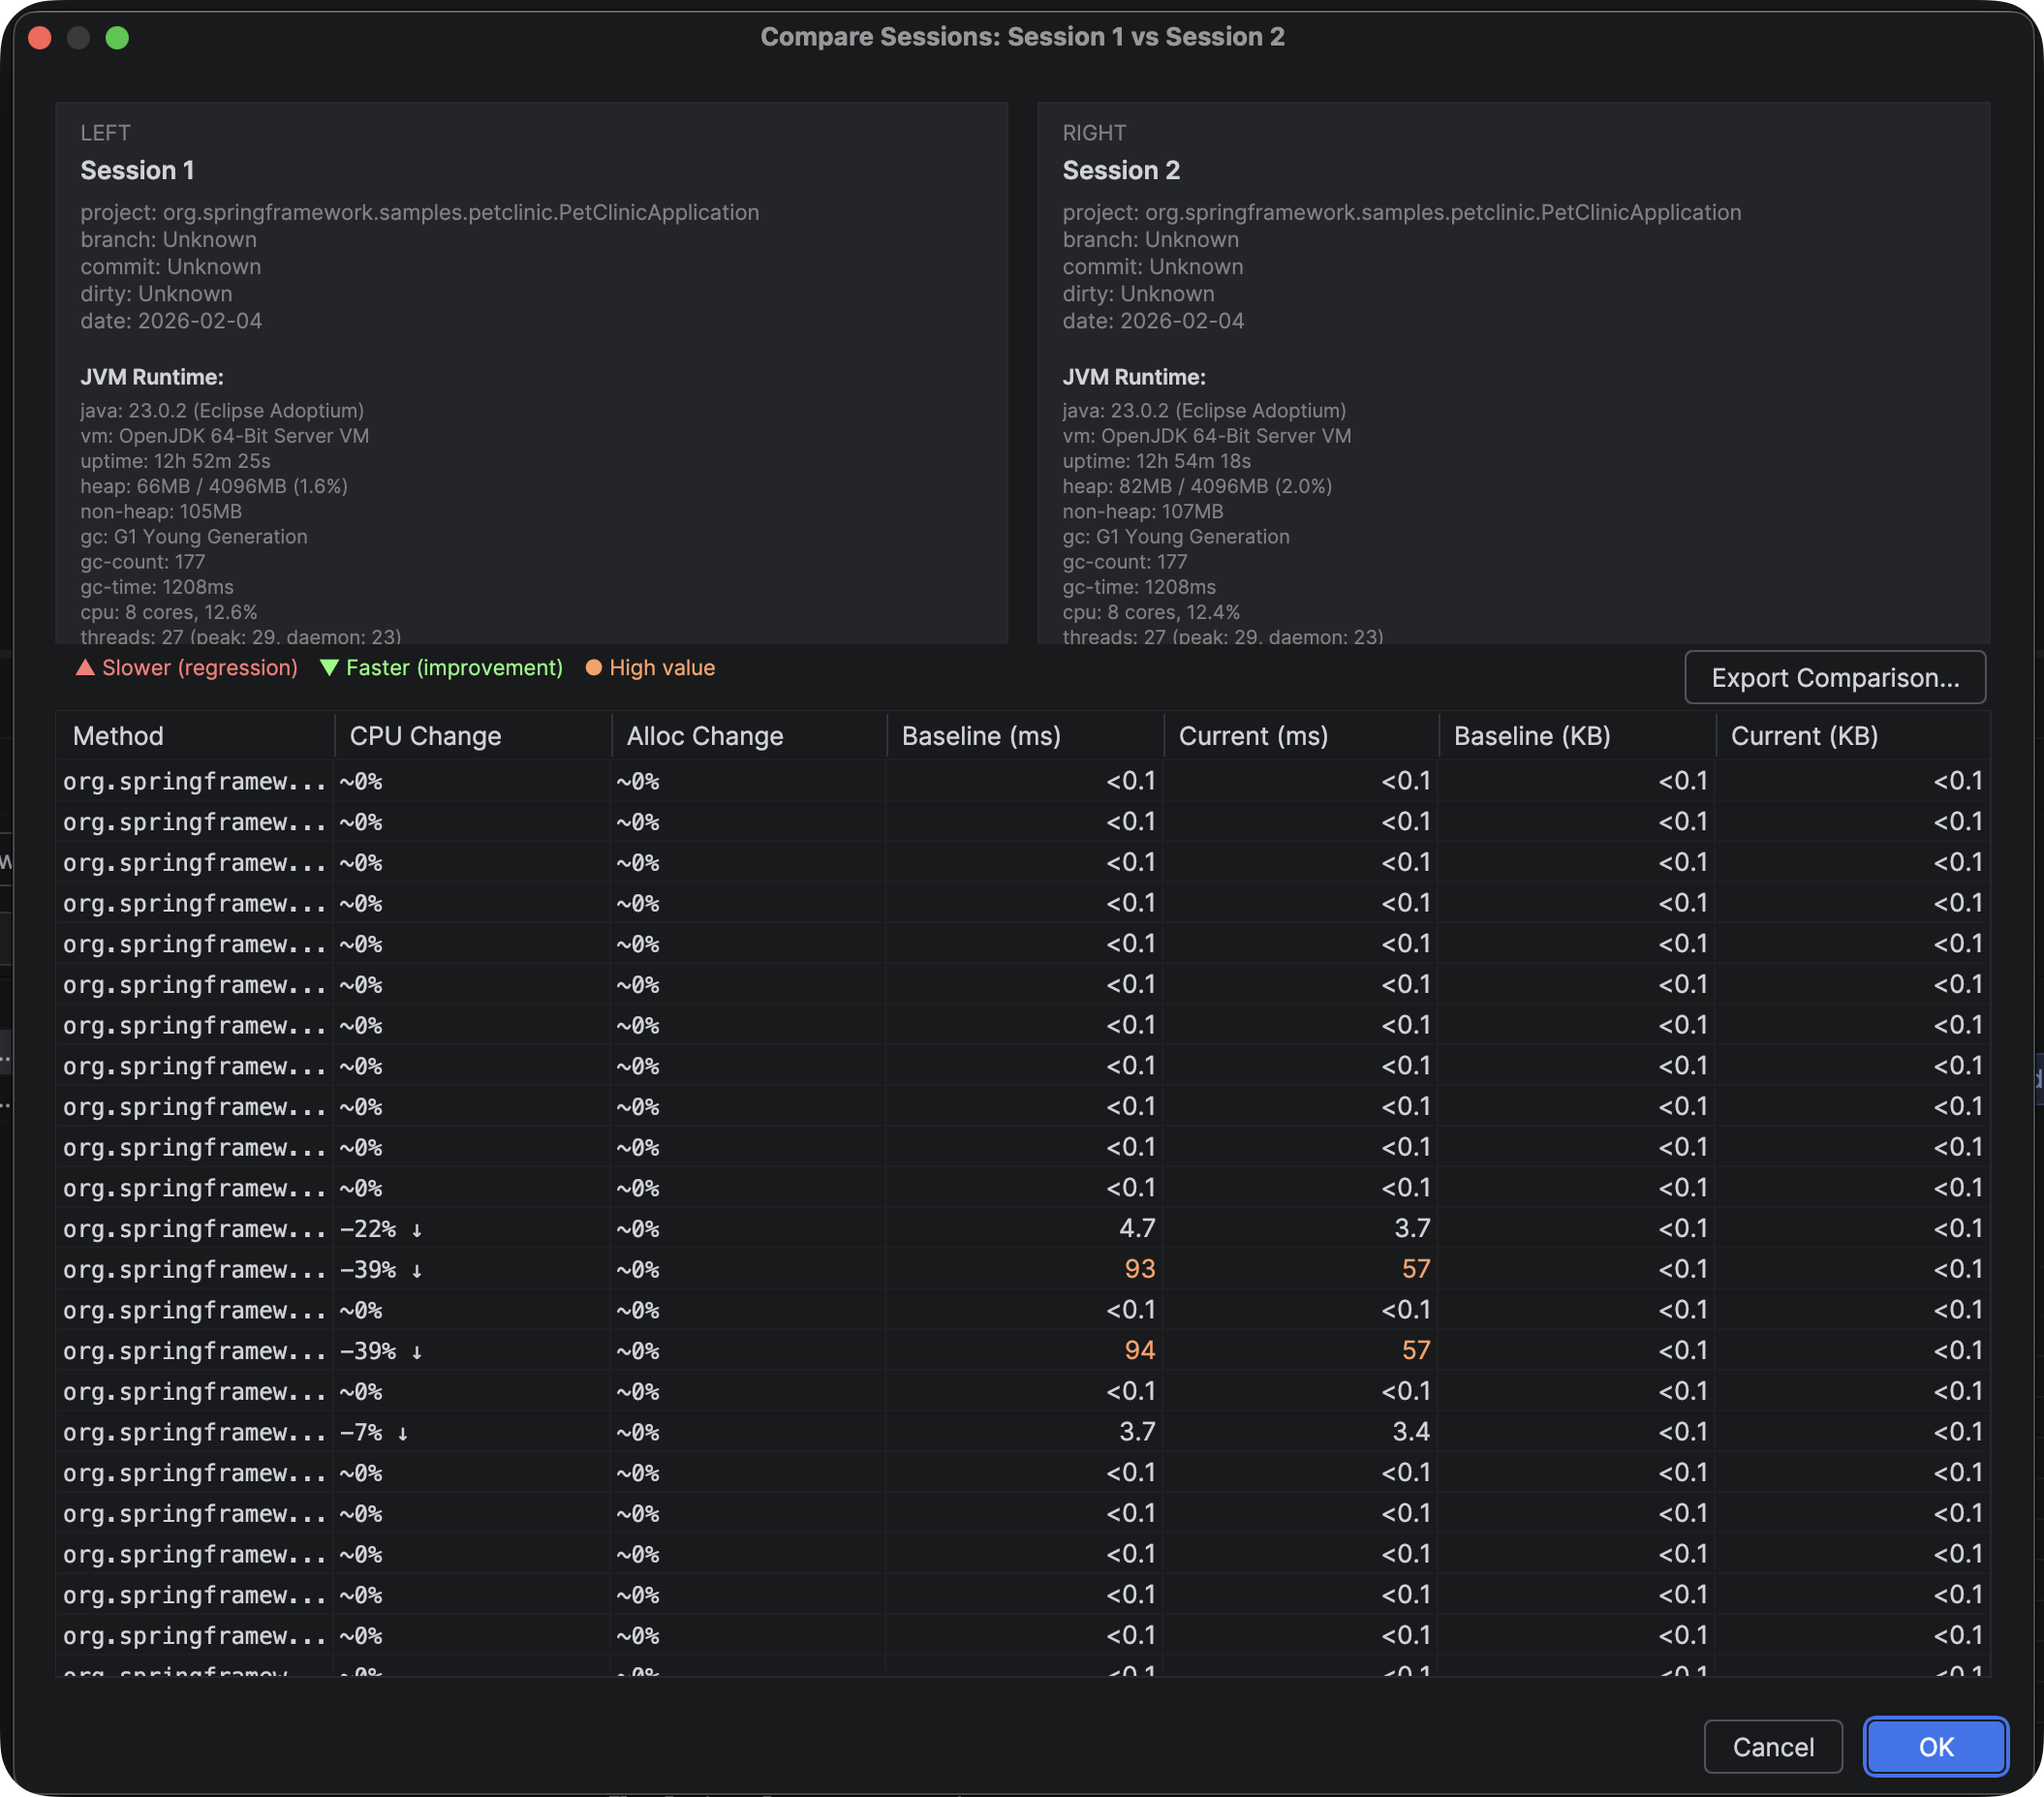
Understanding Comparisons
Section titled “Understanding Comparisons”| Indicator | Meaning |
|---|---|
| 🟢 Green (↓) | Faster — improvement |
| 🔴 Red (↑) | Slower — regression |
| ⚪ Gray | No significant change |
Export Comparison Results
Section titled “Export Comparison Results”Export comparison data for reporting or AI analysis:
- After comparing, click Export Comparison
- Choose format: JSON, CSV, HTML, or Markdown
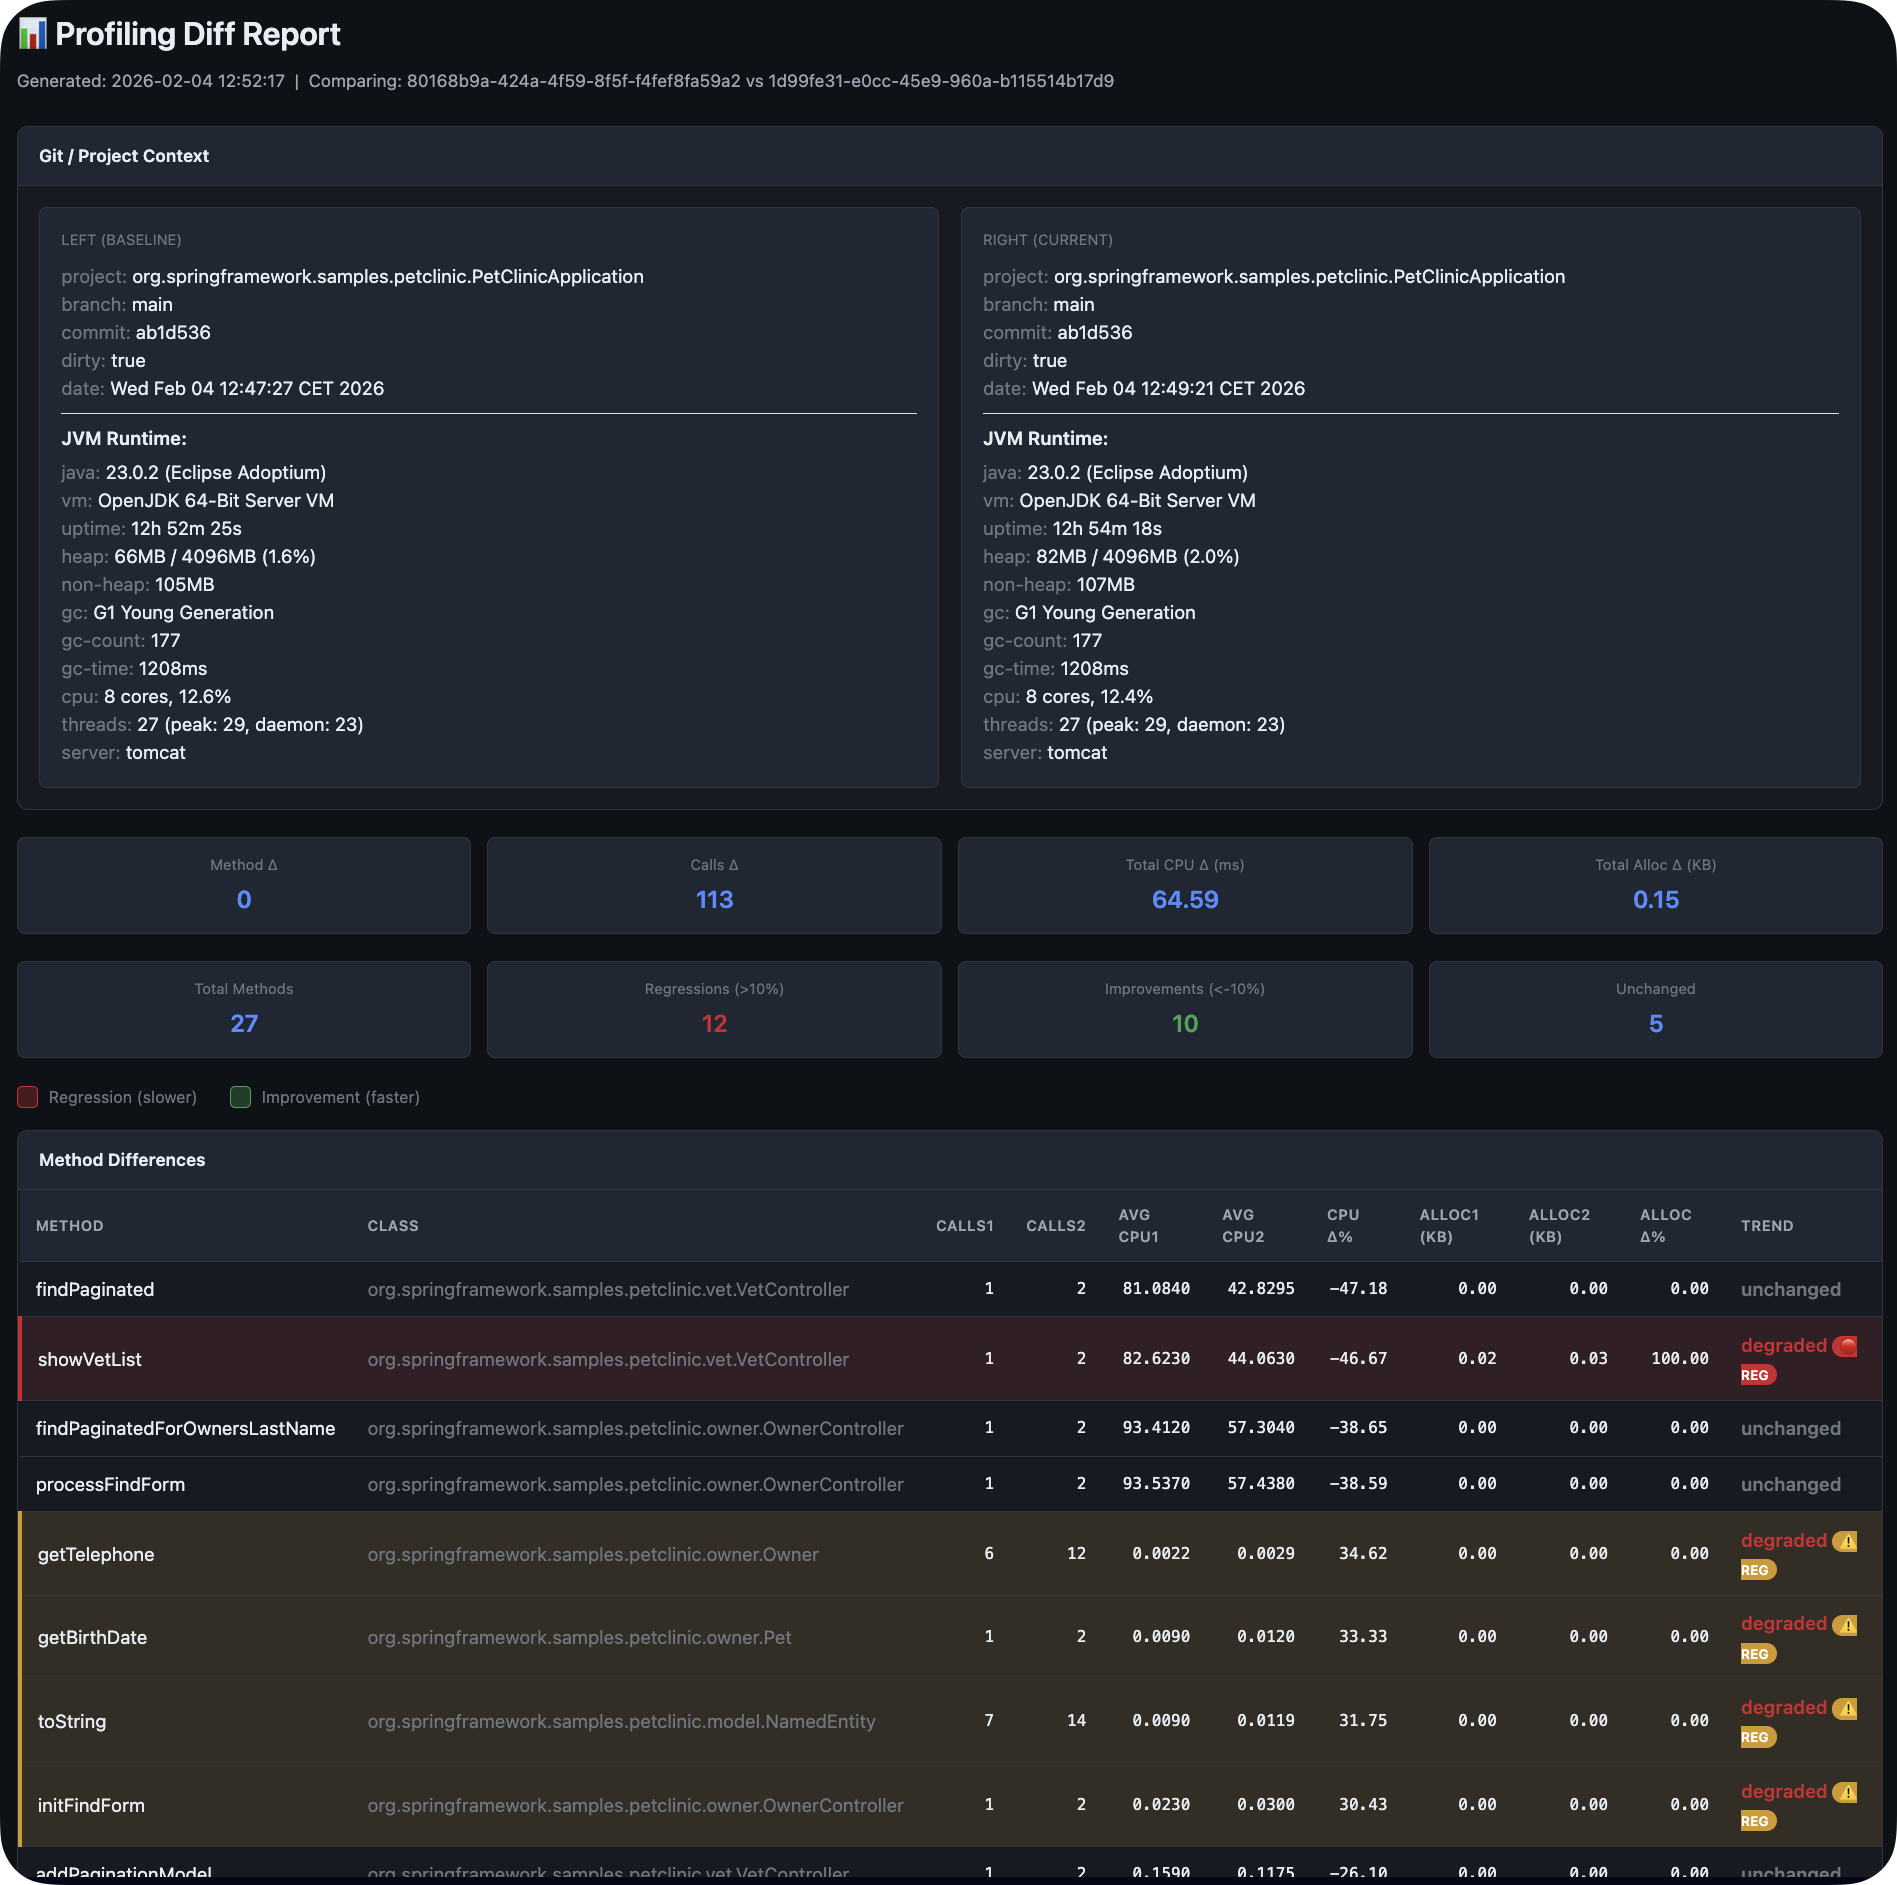
Markdown export creates a baseline-live-compare.md file — perfect for sharing with AI assistants to analyze performance changes.
Exporting Data
Section titled “Exporting Data”Export sessions for documentation or analysis.
- Select a session
- Click Export
- Choose format: JSON, CSV, or HTML
Use cases:
- Share with team members
- Include in performance reports
- Analyze in spreadsheets
Managing Sessions
Section titled “Managing Sessions”Delete a Session
Section titled “Delete a Session”Right-click → Delete
Warning
Deleted sessions cannot be recovered. Consider exporting before deleting.
Filter Sessions
Section titled “Filter Sessions”Use the filter/search to find sessions by name or date.
Name Descriptively
Use names like “v2.1.0-before-cache” not “session1”
Save at Milestones
Save before/after major changes
Update Baselines
Update after verified improvements
Regular Comparisons
Compare weekly to catch regressions early
Next Steps
Section titled “Next Steps”- AI Integration — Get AI suggestions from session data
- Understanding Metrics — Learn what the numbers mean